
AVWAP Course: Stacking
Liberation Day, S&P500 (ES)
Each week I review key moments from recent price action in the indices. These instances will be analyzed using three methods: the tape / DOM; footprint; and candle chart. Synthesizing the three allows an understanding greater than the sum of its parts, leading to a complete understanding of the auction process. There are many great resources out there, although I am not aware of any that provide such a comprehensive study guide.
Image 1. Flock of Eight Hundred Geese. John Taylor, 1887

Stacking AVWAPs
In these examples we explore the use of multiple anchored volume weighted average prices (AVWAPs) to refine trade entries.
For more goose and AVWAP material, please check out an older piece on VWAPs. In the lesson below I’ll bring some more examples to the table that build on the theory of integrating multiple AVWAPs.
This technique is based on an understand of control of the tape, and the overlap of average prices helps to put this in perspective. What are traders likely to do once the balance of control shifts to another side of the tape?
Hopefully these clear examples will be useful in the coming weeks. This technique is especially helpful in a trending environment, which we now experience as the market is in price discovery mode following the end of one market cycle (AI boom).
Again, I work off of a core thesis each morning predicated on market profile, using a pivot as a reference to gauge my chances of success.
I then use price action for my entry cues.
April 4, Multiple AVWAP Example
In a volatile and trending tape (Trump 2.0), I prefer to keep at least one VWAP anchored to the open.
This alone is often sufficient for a good entry once trade retests the AVWAP following a fail.
Image 2. ES 500 tick chart, April 4
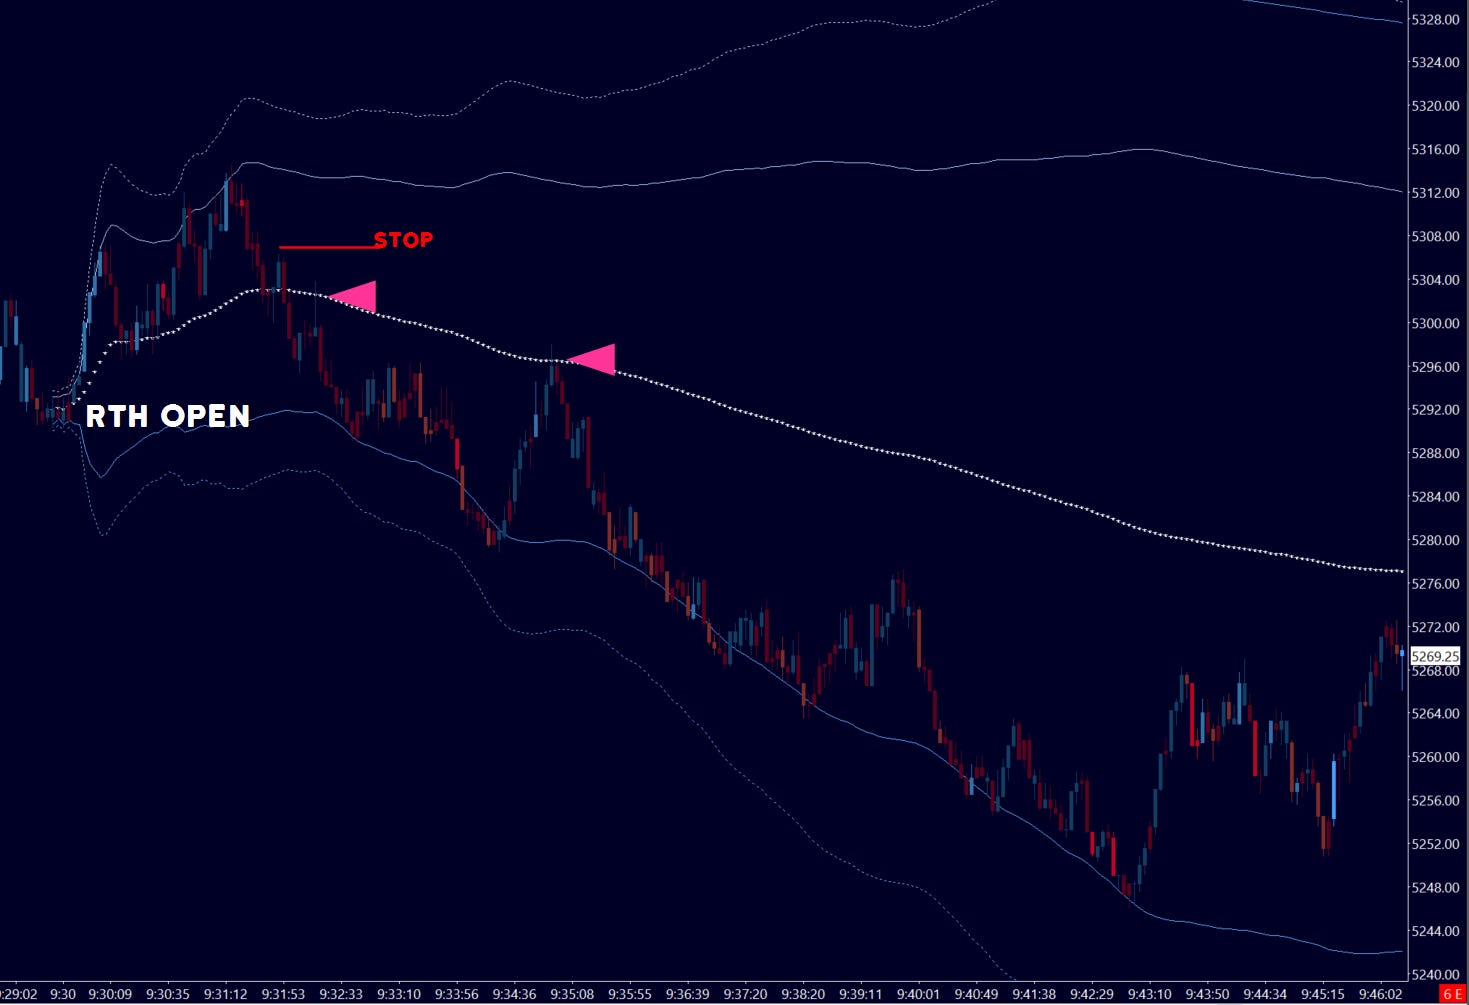
Here I would enter short on a retest once price failed below AVWAP, or wait for further confirmation with a lower low - using the prior highs as stops in each scenario. Either trade would have been good for up to 50 points!
But what would anchoring a second VWAP to the highs do for our understanding of the price action?
That gives me something like this:
Image 3. ES 500 tick chart, April 4
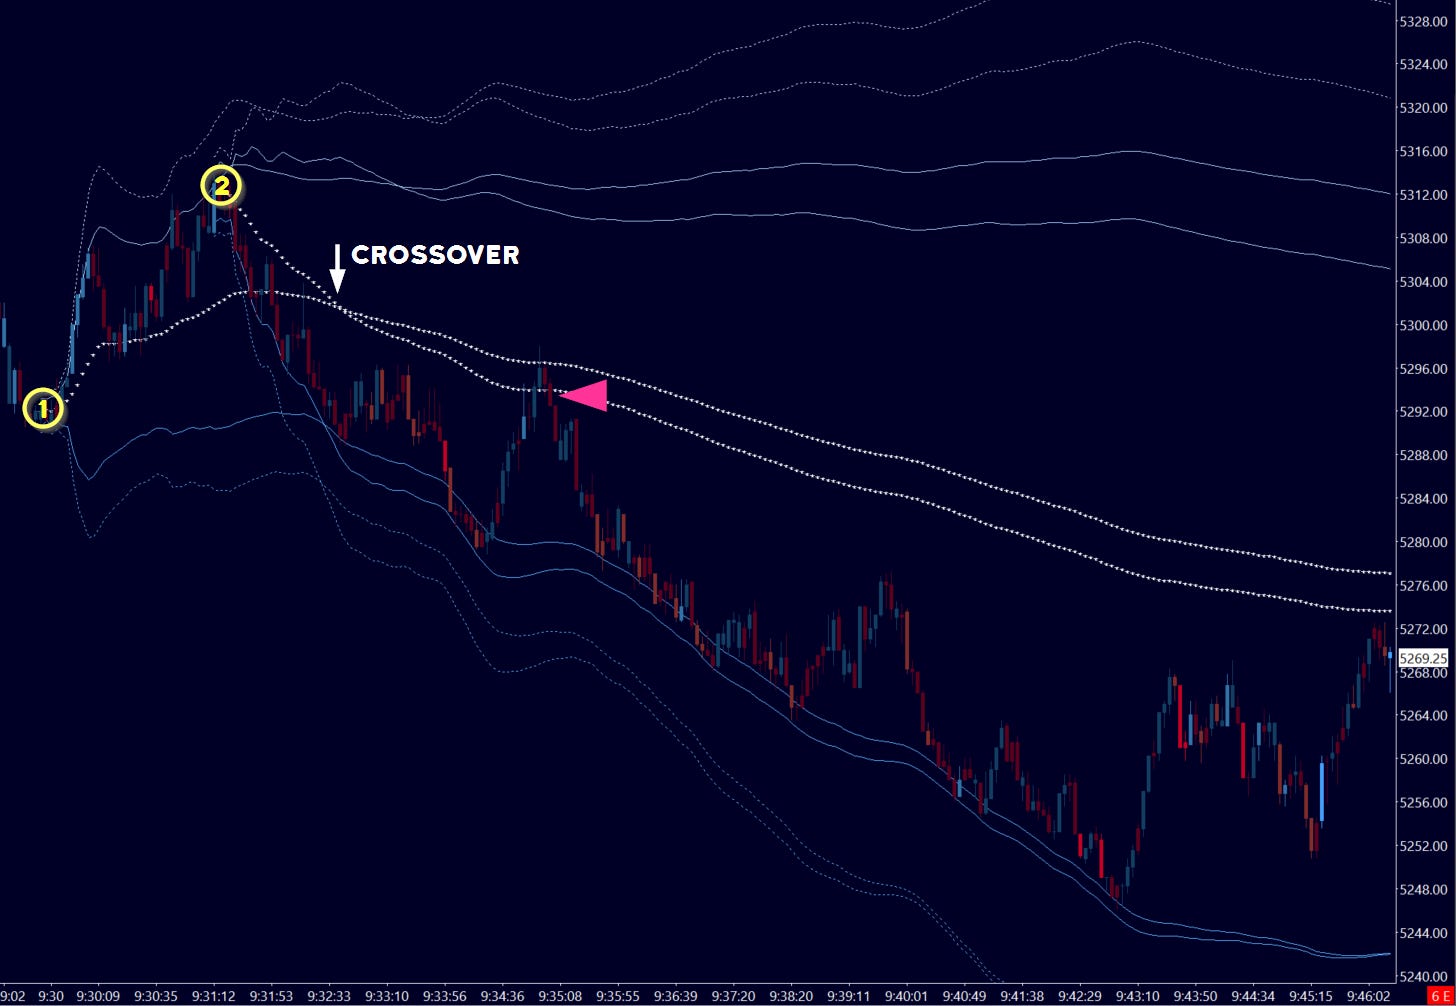
With the crossover of VWAPs, I now know that the bulk of daily sentiment, or longer term traders, are at a disadvantage to even the shorter-term chasers - and those chasers (weak hands) are likely to be the ones to get out first if things go wrong, making the situation more dire for the slightly lesser weak hands from the beginning of the session!
This in effect can make the higher VWAP a more difficult barrier to break - lending confidence to our potential short thesis.
What I do next is stack the ‘short-term’ VWAP throughout the session, on highs or events of note. Let’s see some more examples!