


Trading Course: Anchored VWAP
Lesson 1 of an ongoing series

Every few weeks I share primers on strategies and concepts that contributed to the success of my trading system. Over the course of nearly two decades, these have became the backbone for my toolkit and understanding of the market. I evolved from losses, to breakeven, to a margin of profitability as I incorporated and refined these methods into a systematic and disciplined practice of trading. No amount of indicators or trading advice can substitute for those two fundamental cornerstones of trading. In fact too much information is likely to be detrimental, distracting you from developing focus and self-understanding, thus preventing real progress.
Of the many market tools out there, I chose anchored volume weighted average price (AVWAP) to open with because of its approachability and straightforward synthesis with other methods. Wherever you are coming from - profile, chart, tape/flows, moon cycle - this is a useful tool to have in your back pocket. It may even help begin your market journey. Of course it is not a complete methodology. It makes sense when integrated with fundamentals which we will cover at a later date. There is no sliver bullet in trading! None. (unless you are a member of the U.S. Congress…) So let’s begin.
I. What is a ‘Volume Weighted’ Price?
If you already know these concepts, skip to Section III below. There is much educational content online to entire textbooks so we aren’t reinventing trading concepts or math here. Suffice to say volume weighted average price (VWAP) is an average of the total sum [denoted as Greek letter Sigma: Σ ] of volume (quantity!) traded at a given price. Let’s go to a market:

…Goose spot prices! If you buy one goose at $30, another three at $32 before prices go up too much, and another two at $45 at the last minute when you realize your big eater in-laws are coming - you paid an average of $36 per goose. That is your volume weighted average price. See your blue bracket below. Simple, right.

Now let’s say your neighbor and the Reverend are also planning holiday meals. Your neighbor (anchored VWAP, or AVWAP2) ran into goose price FOMO at the last minute - perhaps falling one goose short when her holiday budget ran out. Her geese cost over $10 more each! It’s OK, it happens the to best of us. Finally your Reverend (AVWAP3) who publishes the substack and knows the goose spot market in and out, waits for the holiday sale. He celebrates dinner a day late, then gets the last geese on fire sale to freeze for the following year (no one will notice anyway). That’s an average price of $2 less than your goose anchored VWAP.
Hey, the substack is free after all.
Each set of prices and volumes here is anchored to a specific date, terminating at a finite point. If we anchor this set of transactions to the start of December, we get the anchored VWAP, or average price per goose for the holiday season. We could anchor to the middle of summer, too, when it is too hot to cook geese and prices are low!

Above is the same goose chart but with chart elements you recognize - look familiar? Those were the daily prices at the goose market, and the volume conducted each day or at each price.
II. VWAP Standard Deviation
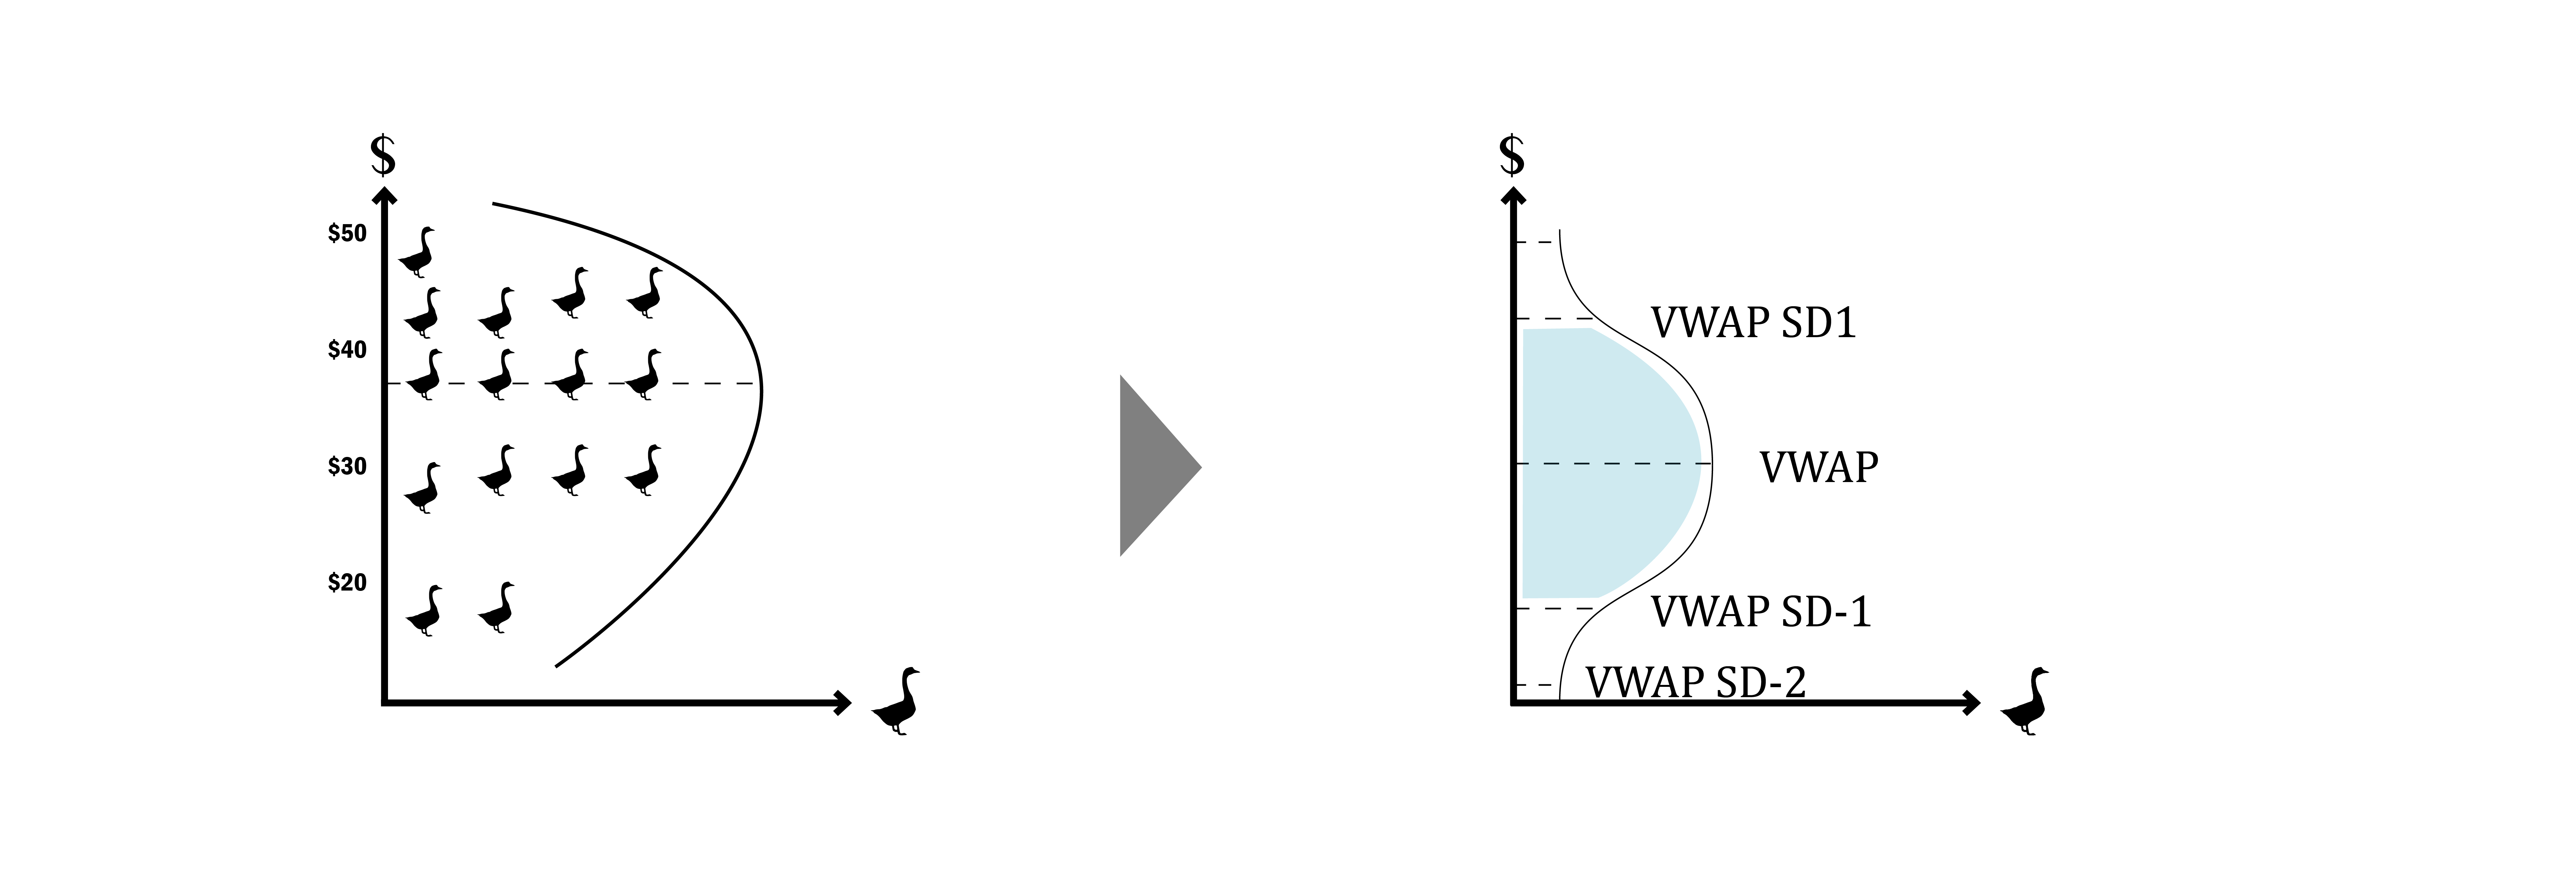
Now for something less familiar - let’s flip the graph 90 degrees by replacing time (T) with volume (V) on the x-axis, then plotting the results for each goose sold. The ‘peak’ of the graph now lies along the x-axis, representing where the most goose volume was conducted (VWAP). This is similar to the market profile in a following part of this series. Finally on the right hand side we have overlaid a statistical distribution of the VWAP. Total VWAP for December lies right about the middle, as expected. Just compare your price or the Reverend’s price to the average - pretty close, right?
Very few people were able or wanted to purchase a goose for $50 each, your [procrastinating neighbor was forced to do so an hour before market close for the holiday! Not the side of the Santa Rally trade I’d want to be on!
So this price is an outlier. The Reverend shopped as the store was destocking the last geese to get the sale price: also an outlier price. In the first example, very few people buy at the high prices… or they break the bank. In the second example, very few stores would sell below cost, or they go bankrupt. Trade naturally tapers off at either side. These extremes are standard deviations (SD) from the mean - as a shorthand we will say 68%, or most of trade occurs within 1SD; and 95% with 2SD.
The same principle applies to the AVWAP example from earlier. At any given time and from a set time (anchor), all possible prices will lie within a potential statistical distribution from the mean (VWAP). As mentioned before, activity tends to dry up at the extremes, or SD2 and beyond. Most of the volume will occur at prices within 1SD of the mean. Now let’s use this tool for our trading!
III. AVWAP as a Trading Strategy
Knowing this concept, let’s assess trade on Friday September 22, 2023, two days after FOMC. This ended up being a balance day with price discovery to the downside into close. This is helpful to our strategy, as we will discuss later. Knowing the day type in advance will already put you ahead of most traders. Having a feel for day type early on is something that comes with screen time; there are some great resources out there to help you develop these skills as well.
IIIa. Choose your anchor point. This is a personal preference and depends on your timeframe. As we are focused on day trading futures here I will share my anchor points below. This can be Asia open, the prior day close (PDC), the European open, or RTH open. I personally use European open, it simply works best for my backtested strategies. Yours may be different and perfectly valid.
I go in depth in following posts on AVWAP.
IIIb. Set your bands. Likewise this is a personal preference. I keep mine near SD1 and SD2, although some traders may prefer SD1.5, SD 2.5, SD3, or any combination or number of bands. Test out what works for your style. I prefer to keep it simple to minimize noise and indecision.
Don’t fret if it takes six, eight weeks or more in your sim account to figure out a strategy. It’s better than losing six or eight figures. No trading is better than losing money while testing strategies! This is what I have thus far:

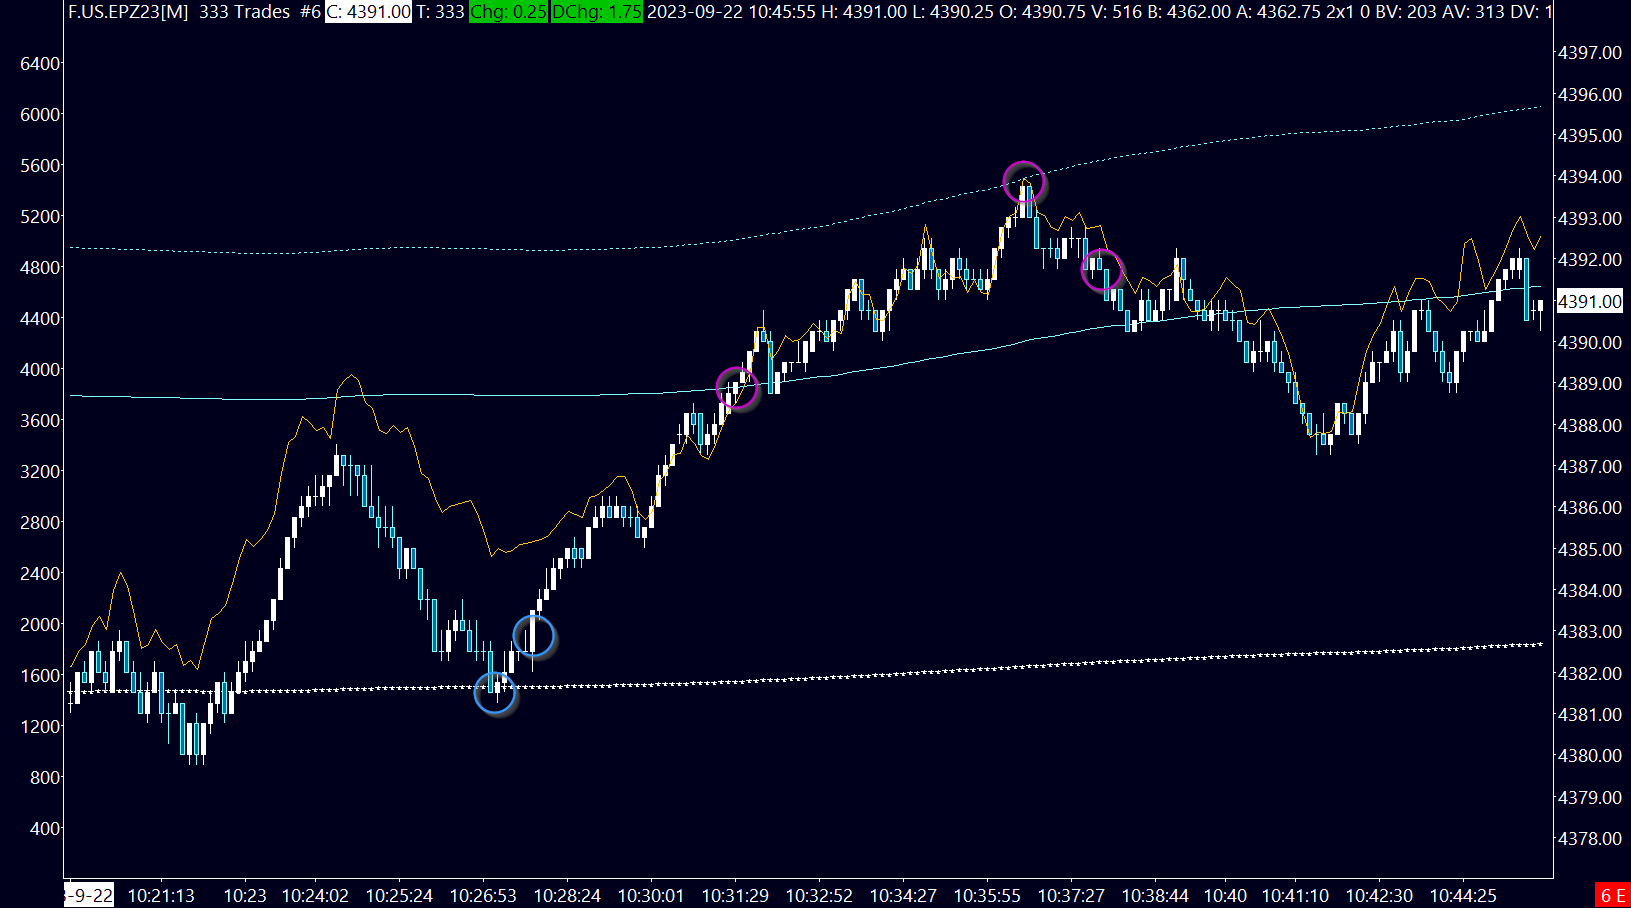
IIIc. Two further notes - and this is my personal preference only - the chart above has price on the x-axis set to 333 ticks. Yes it is a tick chart: every 333 contracts (or whatever amount you choose) register ONE bar. Otherwise, the high/low/open/close look like a normal candle. This is a way to gauge momentum - faster flow produces candles faster. As trade dries up it takes longer for candles to form. Feel free to use regular time interval charts, your edge is unique. Ultimately we are looking at the same things - price and time.
Finally, the yellow line on left y-axis is delta, or difference between contracts traded on the bid (sellside) or on the offer (buyside). You don’t have to incorporate this; it simply gives me an idea of buyer versus seller strength or momentum. You will see how I use this in further examples below.
Example 1. Using our strategy as a tool

We mark the opening range with a yellow box. Open is at VWAP on a near 20 point gap as participants fight out fair prices following strong downward price discovery the prior day. Trade is largely sideways at first with a failed attempt to break above the open. Note delta declining as buyer lose steam. We make a higher low until price begins to drift back into VWAP (dotted white line). Then, at the confluence of VWAP, opening range, falling delta, and failed initiation (wicks to the upside), we have a good spot to lean against the VWAP with a potential short trade. Not only that, but 4383 is a level we had on watch.
We could target to VWAP SD-1: the next lower blue band. There is some divergence in price and delta as the steepness of the delta curve exceeds the fall in price. Although it is momentary, the next higher low may be a signal to look for an exit. While we did not quite reach it, it is a valid exit and good for five or more points. Enough to get a positive start on your day.
A short time later we retest the open and VWAP, while also marking a lower high.

This time the action is cleaner. Note two possible entries leaning against the VWAP, with clearly defined risk above the prior high. We end with a clean touch of VWAP SD-1 and 4375, also a prior level. If you were looking for a long, the SD-1 convergence with 4375 could be an area to lean against, with a stop under the low after the higher low is confirmed. Note then the touch to VWAP, the next higher low, and finally the touch of SD1 - two locations to scale out of a trade.
Example 2. Using the strategy from the long side
By the B period, it was becoming clear that sellers had little interest to further explore downside as buyers were holding VWAP with closes above. The unbiased trader may now be looking for a long entry. This came with the confluence of a higher low, touch of VWAP, and a hold of the opening level! An early entry could lean on the VWAP itself with stop below prior low; a more conservative entry or an add could be made on the next higher low and buyer initiation to the upside. What are the targets?
Potentially beyond the prior high - VWAP SD1 and with enough size…VWAP SD2! Note the perfect touch. At this point, volume weighted prices are at the outlier threshold as fewer participants are willing to buy at the prices (although I’m sure quite a few would love to sell more here). This is a great exit, but the confirmation to do so is probably at the break of upper structure and into a new low.
Example 3. No bias! Back to short side

The 4k level has meaning from a psychological perspective. It could be expected to see resistance here. Nonetheless buyers had decent momentum from the open, trading nearly 20 points higher. However notice the divergence in delta (left axis, yellow line), and price (right axis). Price is not moving past 4397 while delta is increasing. Folks are hitting the offer side but not making progress, in other words getting absorbed. Passive sellers are clearly present. Finally, the buyer attempt to initiate through 4000 falls a point short and sellers step on the offer - note inflection in delta. The first lower low is a potential entry, if your thesis was not already to lean against 4000 on any pop.
This coincides with VWAP SD1! As participants find price too expensive relative to volume conducted, we can potentially anticipated a reversion to the mean trade. We stop within a tick of the VWAP as mechanical (short term) traders give a responsive bid. This is a perfect place to take profit.
Example 4. Our last trade into close

Bear with me we are nearly at the end. FYI we have been watching the 4382 level all day - see Example 1 above. While VWAP was supporting price in L period, a push into 4390 sees little follow through. Note delta divergence again, this time prices falling as delta remains flat. Buying effort is not enough to sustain prices. The first close under VWAP and retest from below on selling delta is a good spot to lean against, with a stop above the previous high.
Once again, we will ideally target VWAP SD-1. We manage to reach this price, nearly 17 points lower, within fifteen minutes of the close. Certainly one could leave runners for VWAP SD-2, but with little time left on the clock and large accounts closing positions, a trader may opt to likewise close positions, wait until the exact close, or hold into the overnight session, depending on strategy and risk management.
Closing (pun intentional) Notes
The AVWAP strategy will in general work best on balance days, as price discovery (trend day) is an ‘outlier’ event. In fact, it occurs on average 1 in 9 of trading days. Given an outlier quality of the trend day itself (1 in 9 odds are close to SD2!), price tends to track over SD1/-1 or even SD2/-2. Sometimes it’s best to jump on the train rather than being a hero and stepping in front of it. In this case, VWAP references can be tricky to use, and without a clear strategy it is best to sit out.
Here we are getting in the territory of volatility events here. I will do my best to cover expected volatility in another lesson. I hope you enjoyed the first trading strategy lesson and can potentially begin applying some of this education, especially if you are new to trading.
We will be covering market profile in an upcoming lesson, so stay tuned. In the meantime there are many resources online on VWAP and market profile if you want further information or to get a head start. Thanks for reading, and remember, capital preservation and risk management are key to your success!