
AVWAP Course: Balance Days
July 8, S&P500 (ES)
Each week I review key moments from recent price action in the indices. These instances will be analyzed using three methods: the tape / DOM; footprint; and candle chart. Synthesizing the three allows an understanding greater than the sum of its parts, leading to a complete understanding of the auction process. There are many great resources out there, although I am not aware of any that provide such a comprehensive study guide.
Image 1. A normal day.

Trading for Balance. Yeah It’s Hard
I get a ton of DMs on trend days. Rarely celebratory, as in ‘I kept trying to short/long and lost so much money today…’
But I get even more on balance days, as traders are cut both ways on anticipated breakouts that never come. So this is an important lesson, because balance / normal days typically make more than half of all sessions.
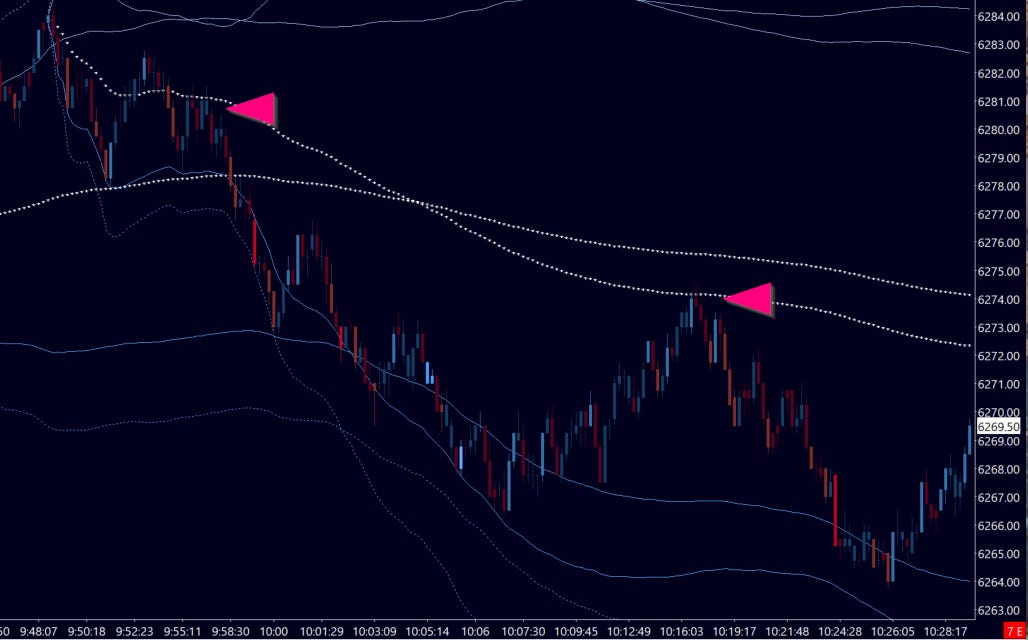
Image 2. Another normal day
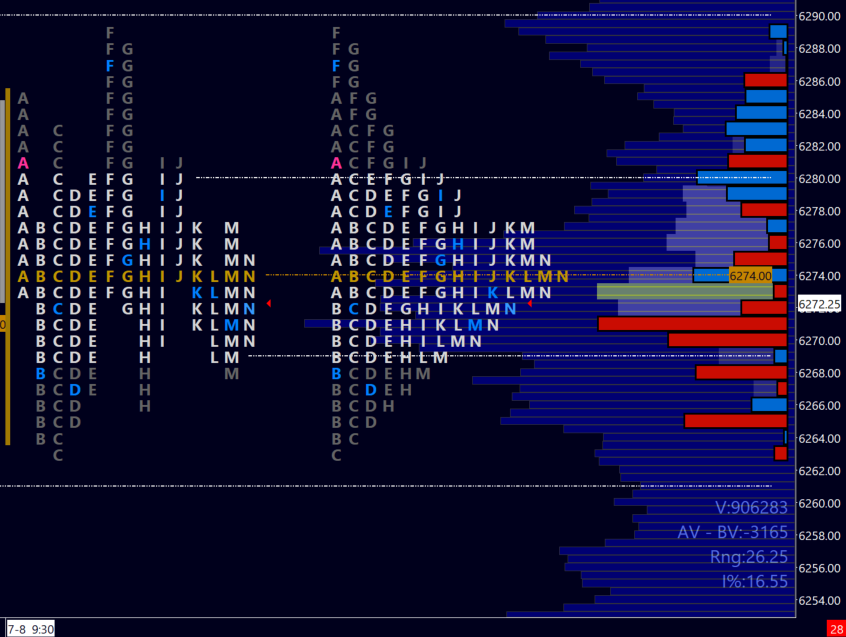
Today’s lesson is for July 8, a classic normal day - a wide initial balance (IB) followed by two-way trade around a point of control (POC).
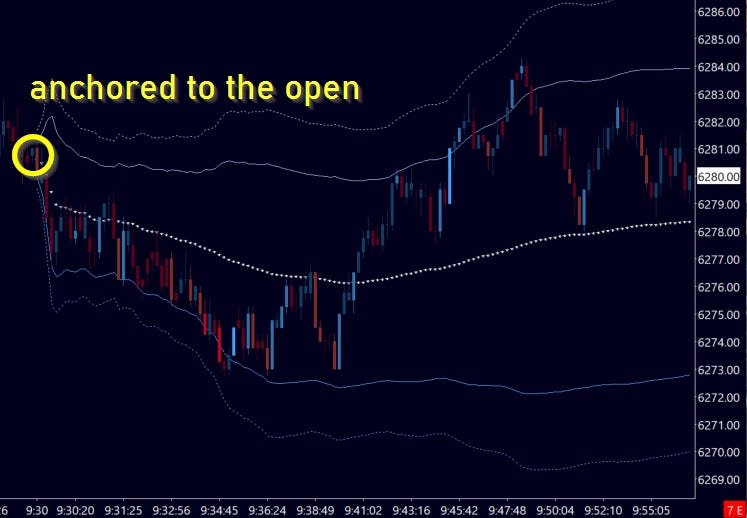
What’s handy is that the VWAP anchored to the open is a great POC! So expect the day to weave in and out of this reference point.
For AVWAP fundamentals, please check out an older piece on VWAPs. Refer back to the piece on integrating multiple AVWAPs. The theory here is fundamental to understanding market control (which side dominates the tape), but the following lesson will be all about applied practice - and straightforward enough that you don’t need to sweat the theory.
Anchoring the Open
Easy enough, right? The overnight session was ‘p’ shaped, indicating absorption. So bulls would be looking for a break of the overnight high (ONH) for continuation, while defense of the ONH would most likely see ranging-action. These clues are very important to keep in your back pocket.
Stay informed, stay sane.
Image 3. July 7-8 overnight session, ‘p’ shaped profile = buyer absorption
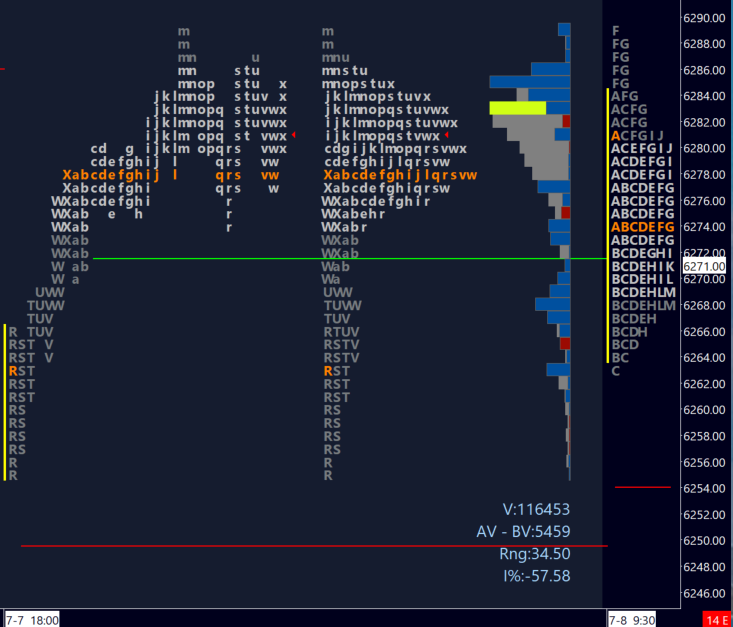
Image 4. ES 500 tick chart, July 8. Opening AVWAP
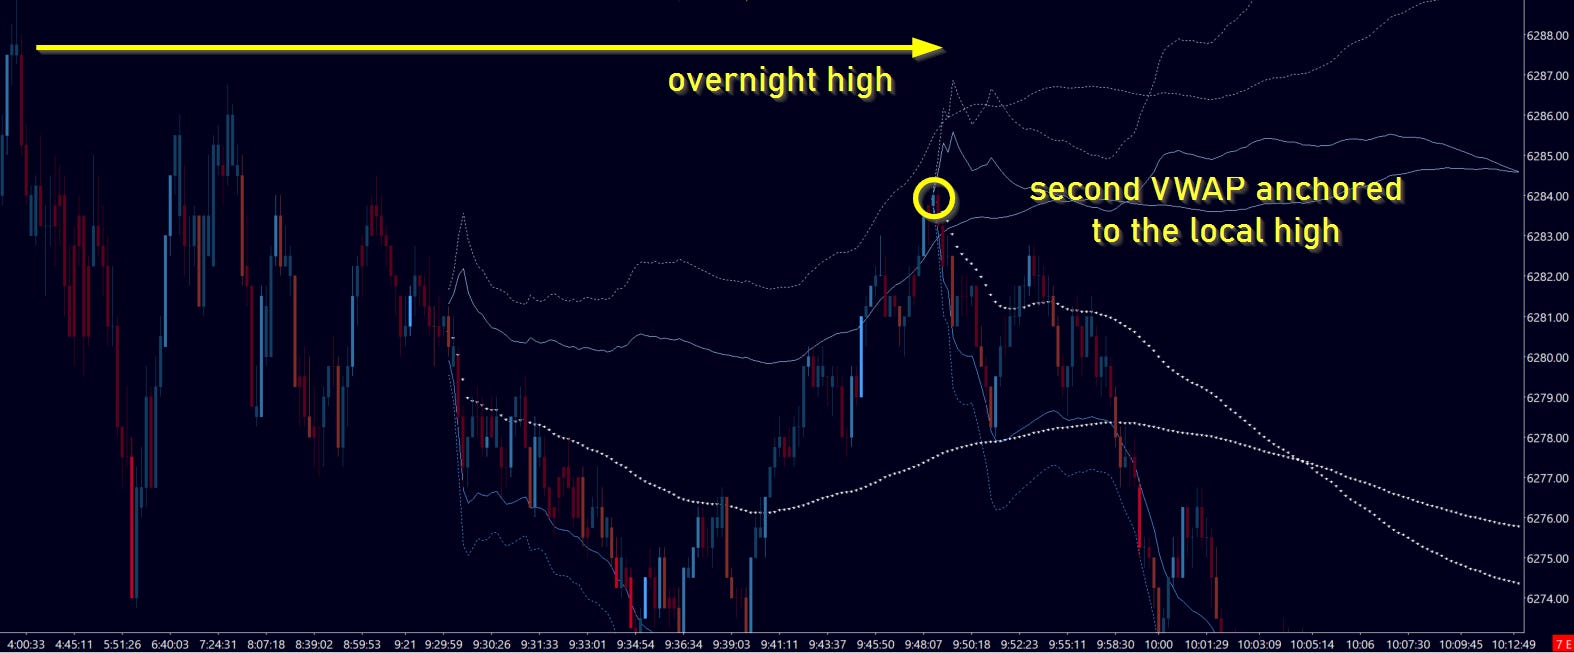
With a failure to break the ONH, it’ll be convenient to set a second AVWAP at the highs. While keeping the first for reference - usually for the rest of the session, unless it’s a strong trend day.
And the astute profile trader likely took a short at the highs, with a stop a few points above!
Image 5. ES 500 tick chart. Second AVWAP at highs
A quick VWAP trader would notice the weakness and set an anchor proactively.
Image 6. ES 500 tick chart. Likely trade locations
however if you missed a short at the highs, no worries - stop chasing at odd locations. Now it’s a game of patience. Expecting balance, short-side is further confirmed with a cross of the second AVWAP below the opening AVWAP. Note the ideal trade location above - and use the theory to understand where to place your stops. Hint: it was a 1:5 RR.
Anticipating a question - but it was only 10 points? Yes, and…? Range days tend to be tighter. And an A+ setup means you can afford more contracts - load the boat.