
Whose Soft Landing
The winds shift.
Image 1. The Fed is losing the narrative.

And the rain descended, and the floods came, and the winds blew, and beat upon that house; and it fell: and great was the fall of it. Matthew 7:27
I will be writing a long overdue macro note in the coming weeks, in time for the autumn. While today’s economic data seems positive at the outset, a deeper look at numbers across the board tells a different story. Two threads unravelling in the narrative fabric will likely come from banking (mark-to-market the books and then note who’s left standing naked) and commercial real estate, which will inevitably spill over into the residential sector.
Another big elephant of course, and the indirect cause (or casualty of poor Fed policies) of higher rates as the governing apparatus like to informs us: resurgent inflation. Furthermore is the tightening availability of credit to the average consumer with knock-on effects to corporate earnings, unemployment creeping up, gross pricing inefficiencies in the market, a bloated Fed balance sheet, geopolitical wildcards, high oil prices, a US election - is it just me or is it getting hot in here?
✙
Often the market can be frustrating around given levels. It can offer conflicting contextual clues, a lack thereof, or react differently to what is expected by a majority of participants. This is the ‘normal’ in markets. This is why as opposed to an investor mindset, we traders refrain from bias vis-à-vis price action. Levels that we are conditioned to see as responsive - for example a precise prior low, high, Fibonacci retracement, psych number, or moving average - may instead trade as if nothing was there!
Again, normal. Both Tuesday’s close at psych level 4500 and today’s close at key buyer LIS 4470 may initially be frustrating to diagnose, but with some remove from the price action they offer some important clues going forward. Read on.
Day Review
The overnight session was decidedly weak with sellers coming on strong in the European session to break below key level 4496. Attempts to reclaim this later failed, and we opened RTH on strong negative delta. In 70% of cases, net short or long inventory from the overnight sessions will see a correction at open. A 1) failure to meaningfully correct inventory indicated extreme weakness; 2) gap down with no counter auction a further sign of seller strength; finally 3) an astute trader will have recognized failure to trade above ETH POC as another strong clue to go short.
The A period easily broke the ONL but buyers stepped in at key level 4485, called out in our plan as a potential area of buying. However buyers were not able to close above the open - a clear sign of weakness, and an area to reshort. This precipitated seller initiation through the lows and into our buyer LIS 4469. This was the last downside target for the day, however momentum favored a test of lower levels from our weekly outlook. The OTFD continued as G period broke the key 4450 level (and cleaned up poor structure to 4451 from our outlook, marking the day’s low at 4447 just below last week’s fair value gap at 4449.5).
Selling tapered here and aggressive bids came in. This began an effective OTFU into the end of the day, with a retest of an intraday LVN in the L period. Poor structure was left behind on the upside, with an unsatisfying lack of excess below which may suggest selling is not entirely complete. Buyers did manage to bring the close back to their LIS - just barely. Given the importance of this level for the validity of the prior breakout, the M period spike high at 4473 will be the pivot heading into tomorrow’s session. Buying was lackluster heading into close - it will be up to buyers to step in or for sellers to drop the initiative to give lift into the week end.
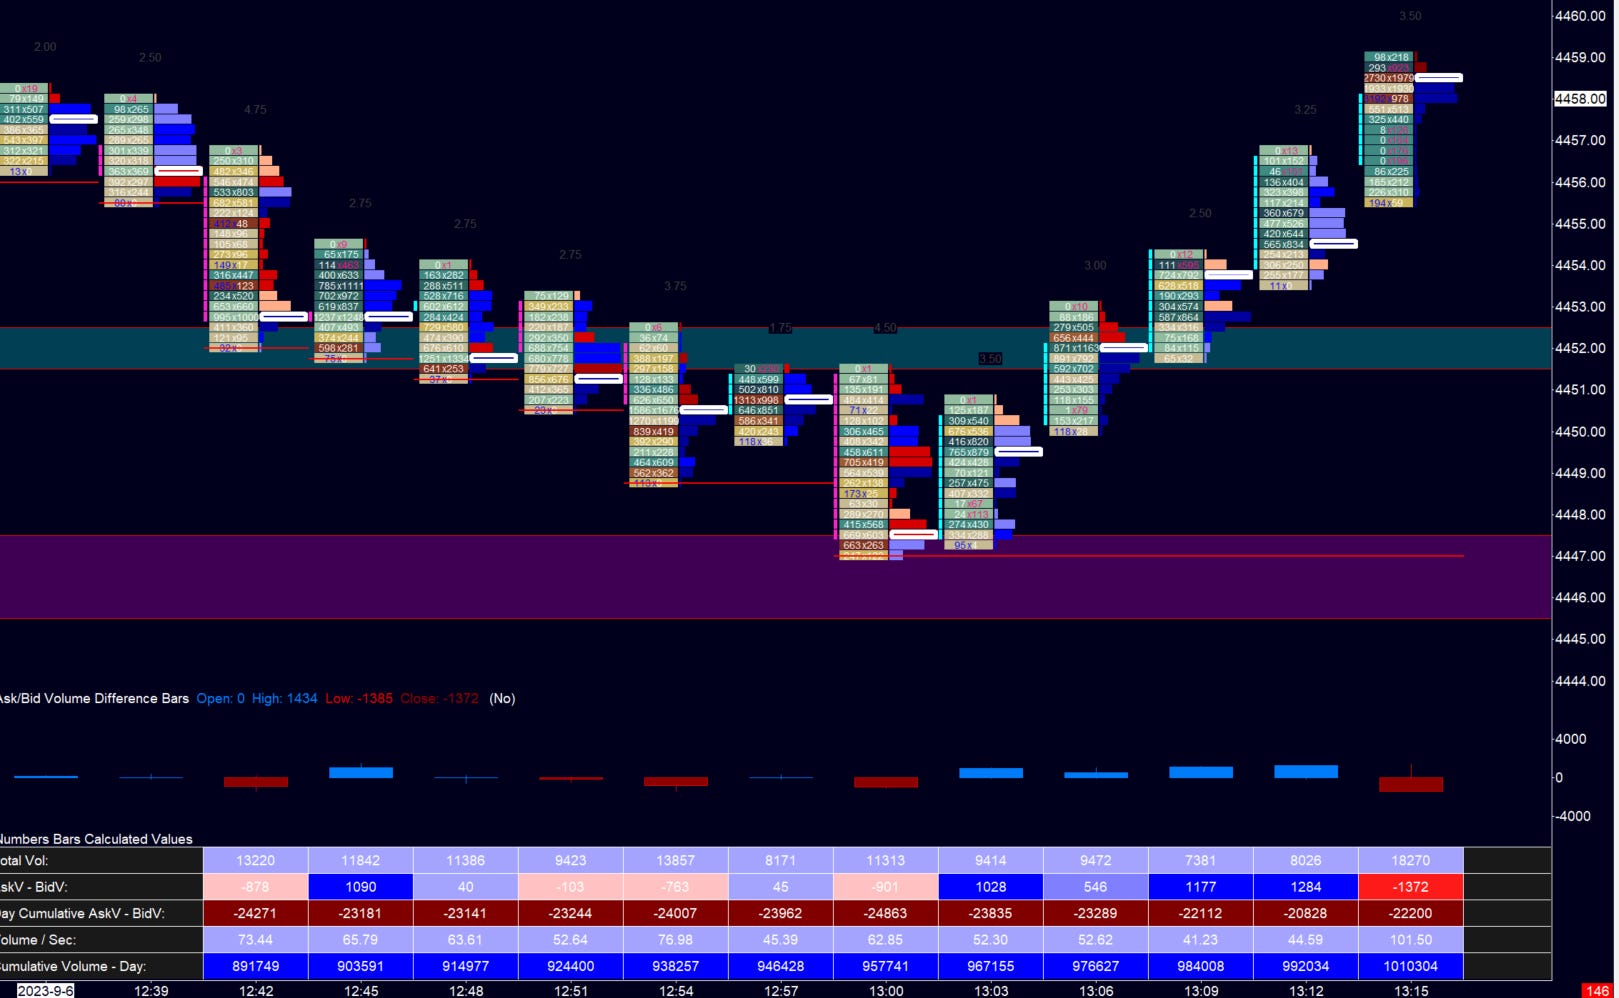
Image 2. Seller exhaustion and heavy bids at the lows. Note the shift in delta (2nd row, bottom)
Thursday’s Missal
Day pivot 4473. We have broken a four-day balance to the downside but closing the session at the buyers’ LIS. The daily is OTFD, while a break of PDL would negate last weeks’ breakout. Short-term and medium-term value are at 4517, with the 50D SMA above at 4498; the 10D SMA potentially offering support at 4457.
Buyer scenario. Buyers look to repair poor structure above 4475 left behind in Wednesday’s session, with a potentially gap fill above 4495 to 4502. The best case scenario would be a return to 5-day VAL at 4507, negating seller initiation to the downside. This could late set up a full traverse of value and above 4533 for upside.
Seller scenario. Time spent below 4470 can aim for 4458 onto a break of PDL 4447. This can open to a test of 4440, a meaningful close below is a very bearish event with final weekly lower target at 4424 - NPOC 4435 on the way.
Sellers want to defend from trade above 4485 or risk a potential short squeeze.
Notes. Unemployment at 830EST.
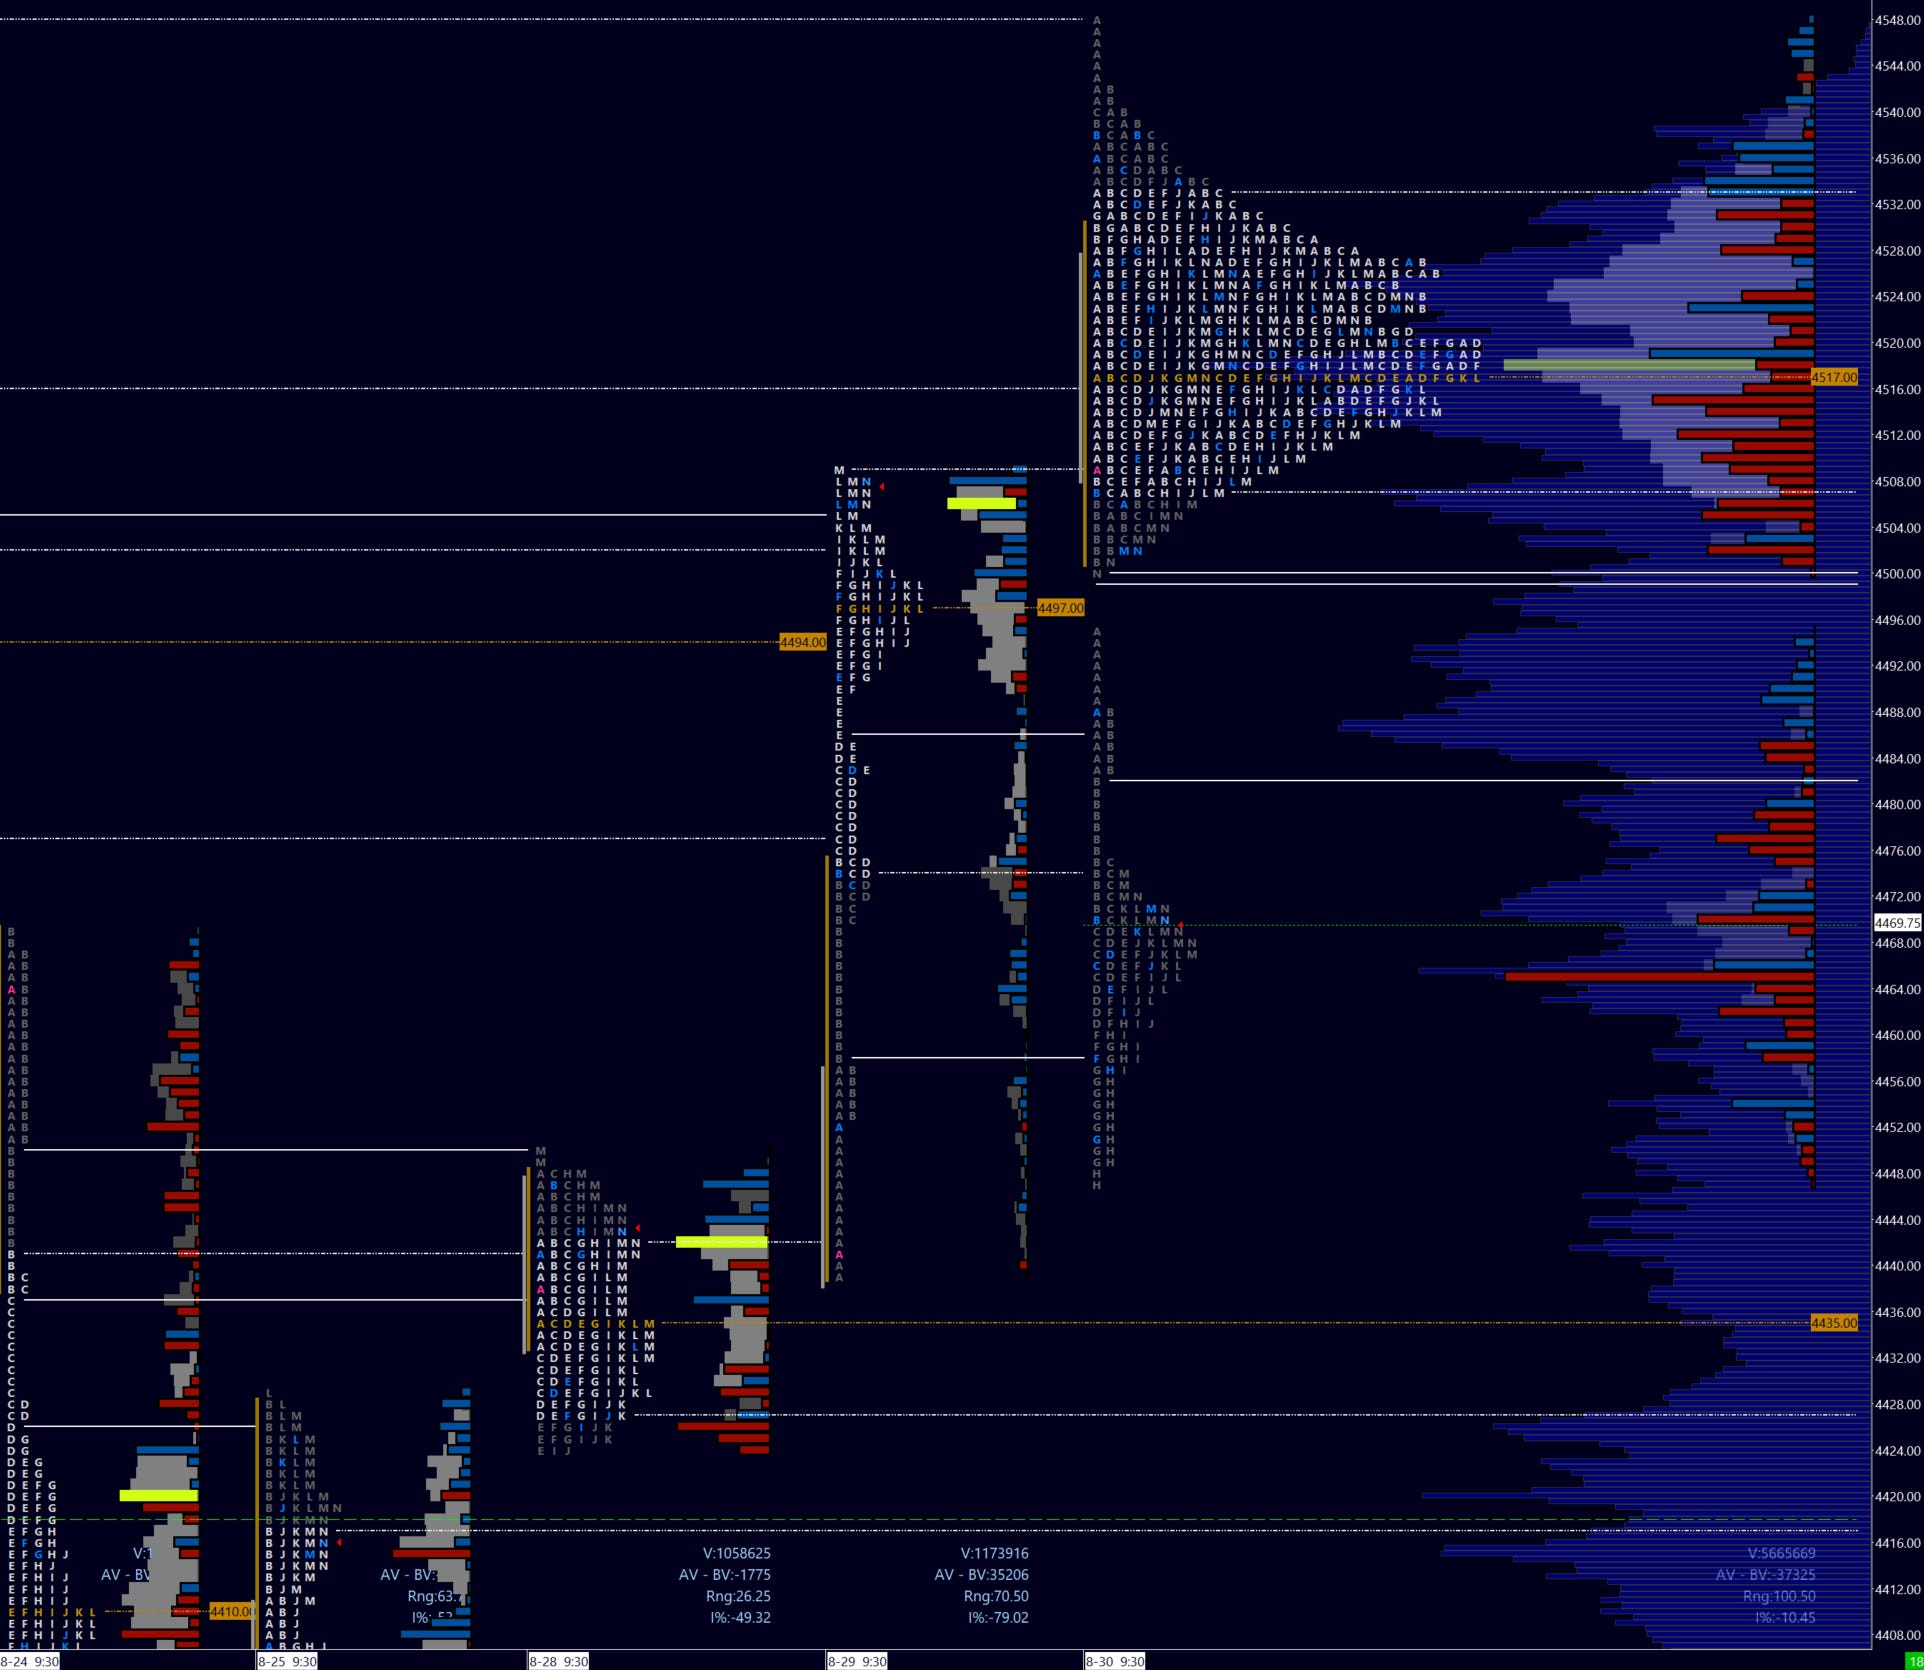
Image 3. A tale of two spikes. Note Aug 29 poor structure repaired, and today’s poor structure.
Tip Jar - your support helps to keep my work going!
Don’t maintain bias in the face of contradicting information! Capital preservation is key.
This is not investment advice and I am not a qualified licensed investment advisor. All information found here, including any opinions, commentaries, and suggestions, expressed or implied herein, are for informational, entertainment or educational purposes only and should not be construed as personal investment advice. While the information provided is believed to be accurate, it may include errors or inaccuracies. I will not and cannot be held liable for any actions you take as a result of anything you read here. As always, conduct your own due diligence, or consult a licensed financial advisor or broker before making any and all investment decisions. Any investments, trades, speculations, or decisions made on the basis of any information found on this site, expressed or implied herein, are committed at your own risk, financial or otherwise.
Good Missal Rev like always love the examples!!!