
Weekly Review and Outlook: Dec 11 - Dec 15
Contract rollover.
Image 1. Bear or big dipper? Depends how you see it. Ursa Major at sunset

We closed Friday’s session marking six green consecutive weekly candles - each close above the prior week’s high. An impressive rally that has potentially put ATHs in view once again. A very likely contract rollover gap on Monday to the upside can put us at year-highs, but do the bulls have anything left to squeeze into the end of the year?
ES Week in Review
My last weekly outlook made a joking reference to ‘porch time’ and a longer wait for action. My expectation was that this would culminate in a break (up or down) for the non-farm employment data Friday. The longer wait turned out to be correct, however we saw very little range expansion given the very long time spent in balance. Last week’s VWAP was 4584.75, just above the balance area VAH. And from two weeks ago, “…until we see a couple of closes above 4600…we are in a bit of a no man’s land” - this still applies.
That range expansion may be due at FOMC Wednesday.
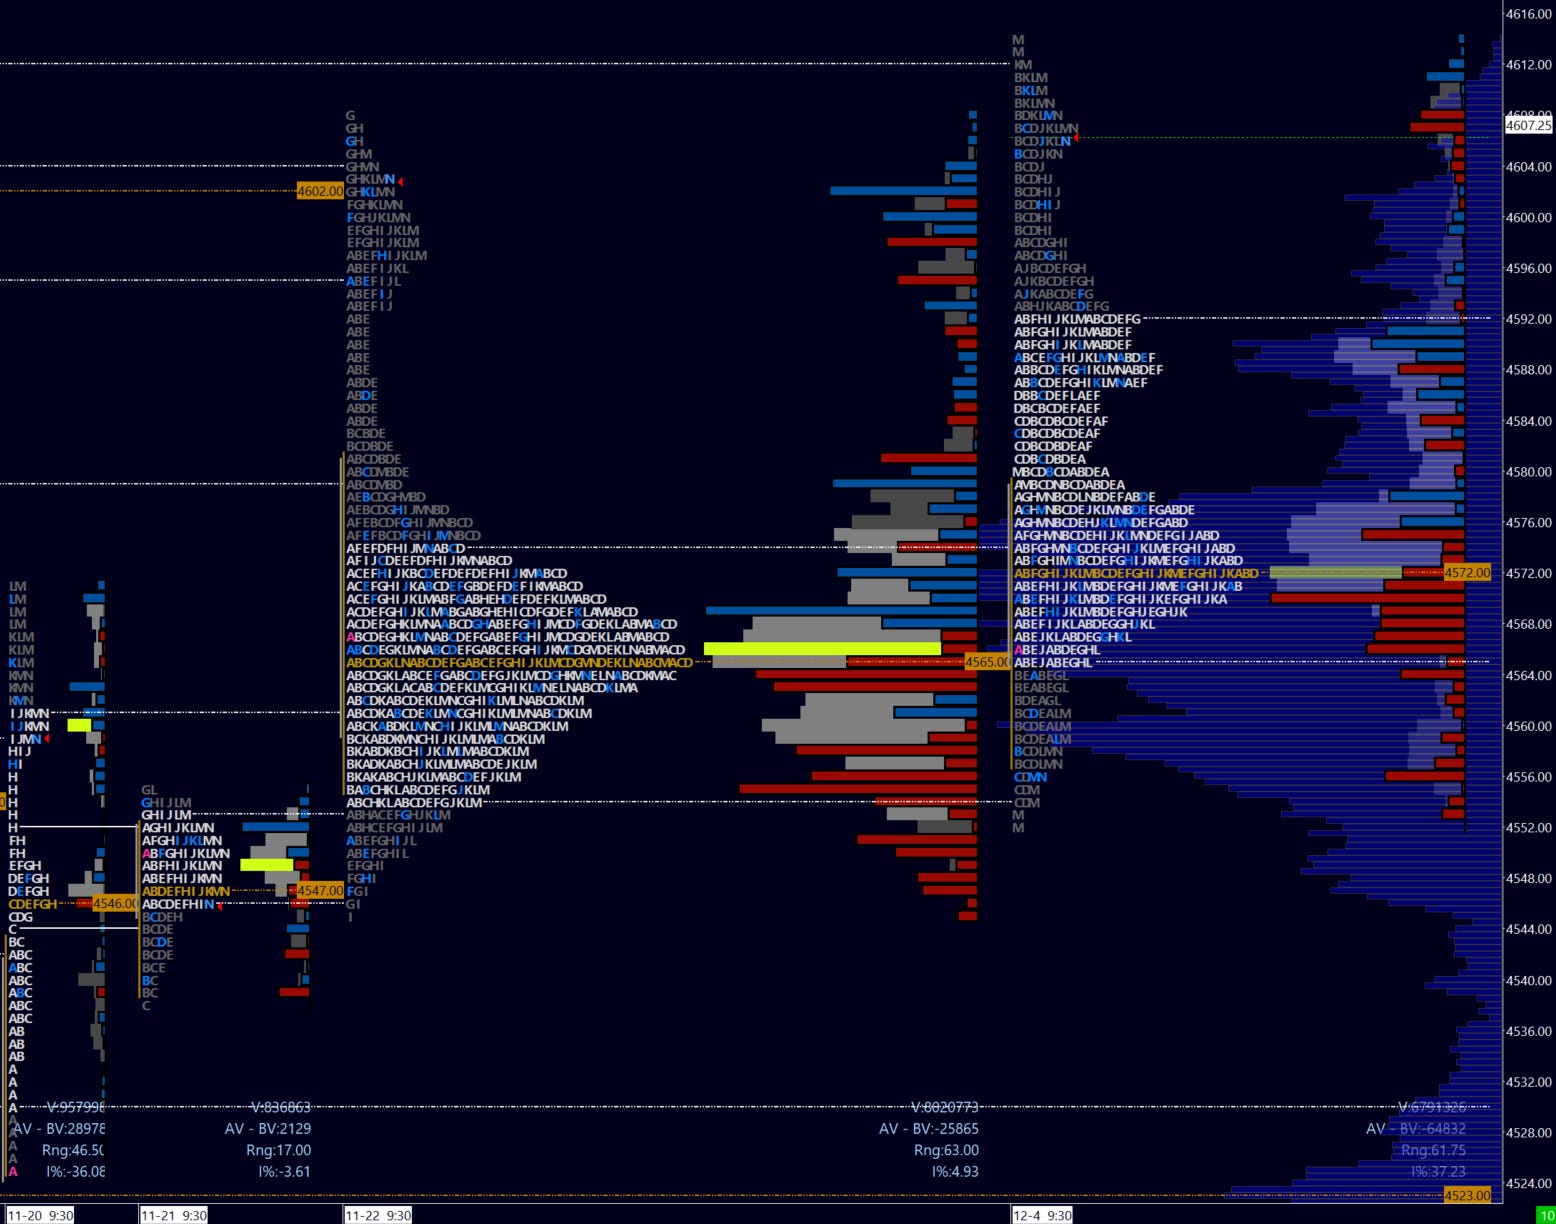
But in the meantime see below last week’s profile next to the prior area of balance…not much to give bulls nor bears. Sellers were persistent below 4575 but not enough to overcome passive buying. Buyers on the other hand could not gain momentum to make a decisive break into year highs ahead of contract rollover. A note on that - I will be rolling over beginning Monday. Prior levels remain relevant and I do not adjust from new contract levels. For reference, December ESZ23 settled at 4606.25 and March EPH24 at 4658.75, a delta of 51.50 points. Going forward keep in mind the contract gap to 4606.25.
For the week ahead I will be referencing the summer high 4634 as a pivot. This may be somewhat confusing early on given the contract gap however this is a straightforward reference for buyer appetite or attractive prices for sellers.
Image 2. Weekly structure. Note the triple volume distribution and continued balance.
There are many events this week that likely see volatility, below a short list of the major ones to look out for.
Monday - 13h01EST, 10-year bond auction
Tuesday - 8h30EST, CPI; 13h01EST, 30-year bond auction
Wednesday - 8h30EST, PPI; 14h00EST FOMC; and 14h30EST FOMC presser
Thursday - 8h30EST, retail sales, unemployment
Friday - 9h45EST, PMI
Read below for weekly levels. Monday’s plan will be issued premarket,
Next Week’s Outlook
Reminder I do not adjust prior levels. These can remain important references sometimes for years - consider ATH for example. Levels below are for EPH24 March contract. I will use the 4634 summer high as a weekly pivot. An early close above 4650 can see a grind into higher prices, while shorts look to see closes beneath 4580.
We remain OTFU on all timeframes.
This week’s references:
4760 buyside liquidity
4715 weekly balance VAH
4695 weekly balance POC
4660 EPH24 Friday close
4634 weekly pivot
4606 rollover gap
4571 balance POC
4545 balance low
4522.50 NPOC
a) Buyers closing above 4660 encountering little resistance will target 4695 where passive sellers may begin to emerge through to 4715. Further above could see a ‘rescue mission’ to the area of old business around 4750. Recall ATH at 4808.
Buyers’ LIS is 4575.
b) Sellers need selling volume below 4634 to target 4600, which may see initial responsive buying. If this is broken on momentum, passive buying may be seen at 4571, the balance POC. A rout of buyers on a hawkish Fed or bad data points this week could potentially see further liquidation to 4550.
Gold (GC)
Gold had quite the jump to ATHs at 2152 but was quickly beaten down to close the week at 2014.50. This was perhaps a let down for gold bulls who were excited about a potential break out after over three years of consolidation. With two weeks left of the trading year however, gold bulls are still eyeing for a potential monthly close above the ever-important 2085 level. Such an event could begin to see some unwind in short positions, targeting 2250 and 2400 further above in the weeks and months ahead.
For now the 2000 price point will act as a pivot. Longs want to see 1970 supported. The short side wants a break of 1935 which could mean a potential attempt to trade back under 1900. Short-term resistance may come in at 2044, but with a close over the ‘ever important’ key level into higher targets mentioned we will be at the start of something bigger, with years of unwind into… a cyclical uptrend in metals.
Well, no promises on silver (SI) yet… !
For gold stocks, NEM remains a favorite as it offers a healthy dividend, with potential support at 36.50. Longer-term I do believe this stock is oversold. A weekly close above 41 can see 44.50 tested, with 49 further above in the longer-run, perhaps by mid-year. Shorts meanwhile want a break of 36 which will target 33 and 30 where we find longer-term support.
Crude (CL)
Oil has disappointed the longs, with prices falling despite the geopolitical tensions in the Levant and broader Middle East. Crude is however has reached support here at 70-70.50, as demonstrated by the responsive buying last week. I consider 65.50 a LIS for the long thesis. Near-term, a daily close above 71.50 could see recent shorts trapped and a potential run to 75, with 78 further above where sellers may be found.
Image 3. A crude look, approaching longer term support (yellow line)
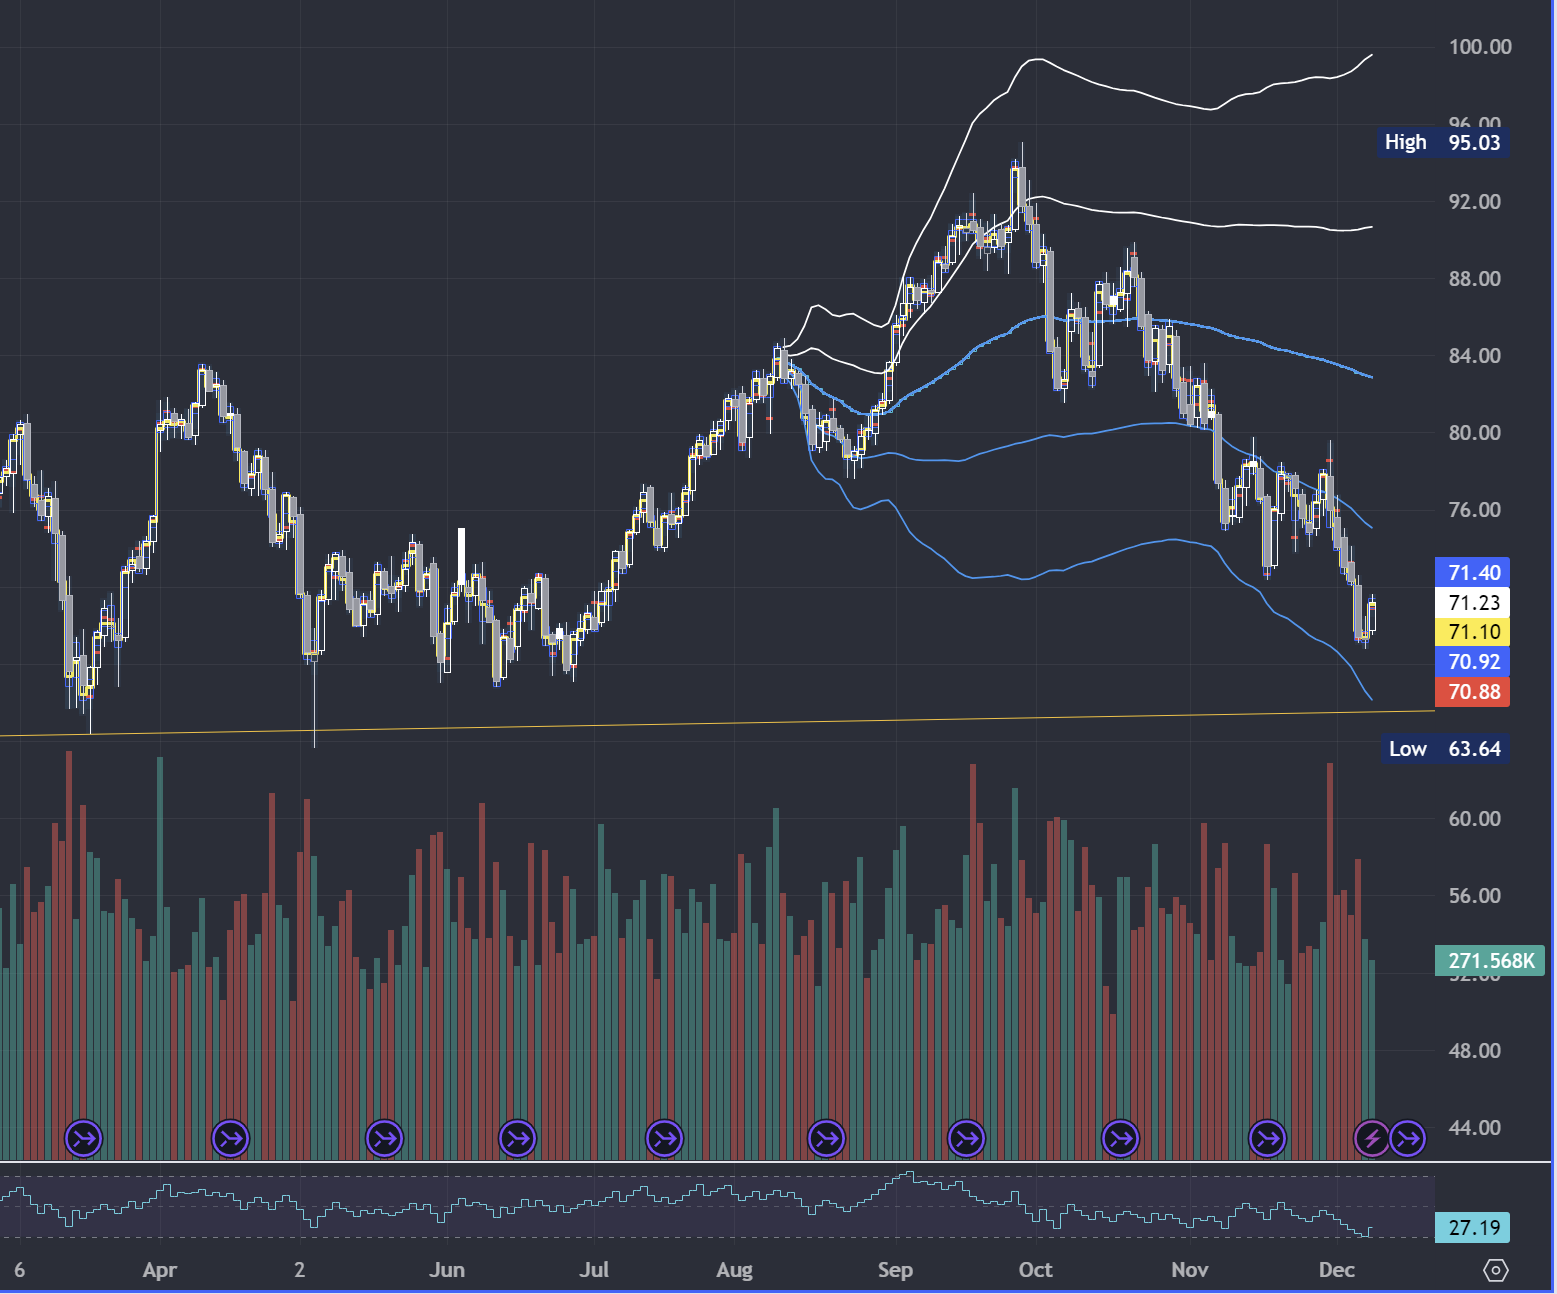
On the short side, a close beneath 68 targets 65, with 62.50 further below. Longer-term, a weekly close under 60 could be a bearish event for the indices. This translates into a deflationary event in the context of a global slowdown. Any oil shock, such as a Houthi attack on Saudi facilities or open conflict with Iran could mean prices north of 95. The latter is a tail event but the risk to the region now is higher than it has been in decades.
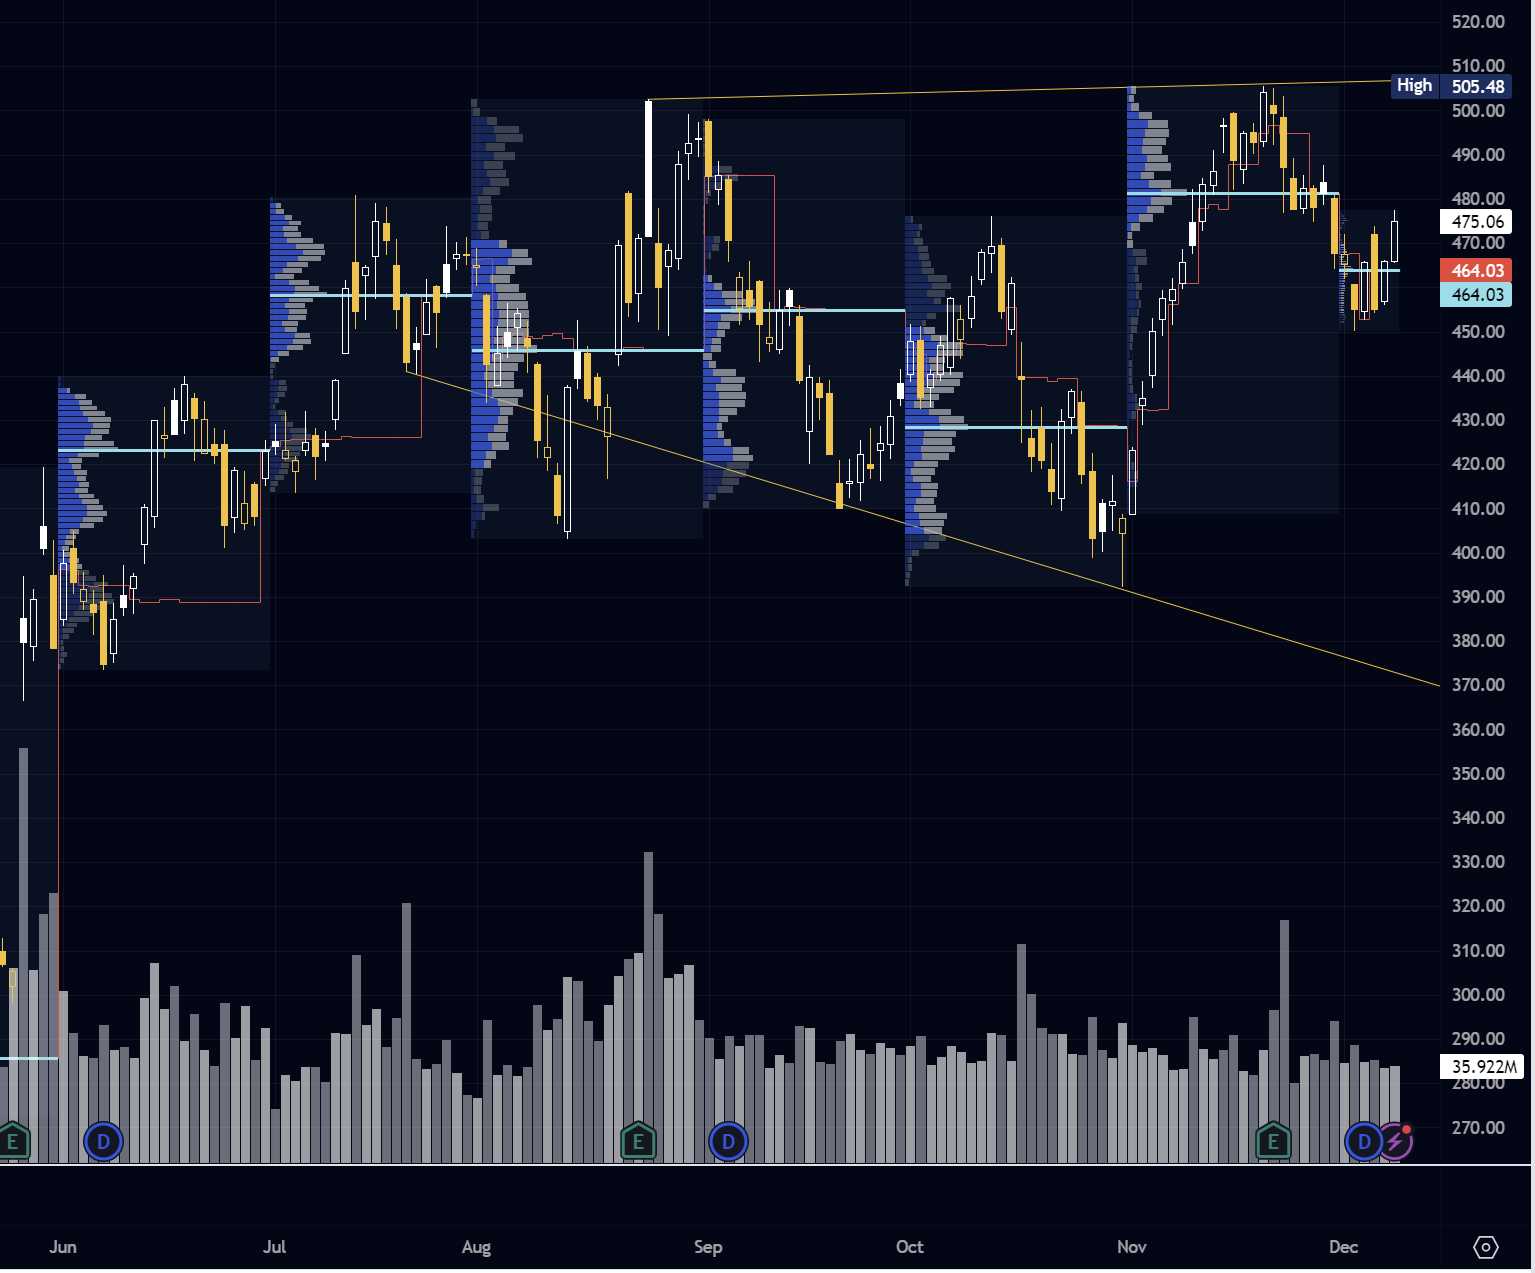
NVDA and TSLA
Finally, the AI binge may have run its course for now, with NVDA struggling to regain 500 and trapping more hopeful longs. Look for resistance at November POC 481.50, a likely pivot area. A break of 487.50 further above could see longs attempt 500 once more. I think 530 is the ultimate prize for bulls in this cycle. Shorts meanwhile would be assisted with weakness in the indices, targeting 445-50 support. A break can see a 423.80 4H gap fill, with shorts eyeing 405 further below and an area of likely passive buyers.
Short-term NVDA may be the worse buy relative to AMD; its record earnings have simply not propelled the stock higher. Difficulties with its China business may pose further downside risks.
Image 4. NVDA Daily chart - all about that 450 support
Likewise TSLA can see support at 235, but a fail of this level can see a 4H gap fill to 225. Sellers could then attempt to see prices return to the lower balance at 220. In the near-term this is a tale of two balance areas. A break of 249.50 targets 255 where passive selling may be encountered, with 262.50 above. Overall I think this is a weaker stock in the index, or at least until we see a weekly close above 247.50. Real weakness could come with a close below 200 in the longer-term, which would see longs from the summer highs liquidated. Potential headwinds include higher for longer rate expectations, putting a dent into sales; a looming shift in power to the Republicans and this higher risk to the EV incentive tax credit; as well as a hard flop of its Cybertruck (and just plain ugly?) roll out.
Tip jar - support my continued work!
Your support and comments are appreciated. I do my best to respond to everyone in a timely way. Be sure to follow me @reverend on X (Twitter) for the latest updates!
Don’t maintain bias in the face of contradicting information! Capital preservation is key.
This is not investment advice and I am not a qualified licensed investment advisor. All information found here, including any opinions, commentaries, and suggestions, expressed or implied herein, are for informational, entertainment or educational purposes only and should not be construed as personal investment advice. While the information provided is believed to be accurate, it may include errors or inaccuracies. I will not and cannot be held liable for any actions you take as a result of anything you read here. As always, conduct your own due diligence, or consult a licensed financial advisor or broker before making any and all investment decisions. Any investments, trades, speculations, or decisions made on the basis of any information found on this site, expressed or implied herein, are committed at your own risk, financial or otherwise.