
Using the Profile VI
Robot Attack

Another look at using the market profile as a powerful tool. This is at the core of my daily planning and identifying levels - in this lesson we will look at profiles in the context of the week.
Image 1. Revisits. Double Indemnity, B. Wilders (1944)

The Market Profile
Recall the study guide from CBOT. Yep, you can find it for free at that link, no sign-up necessary.
Let’s put last week into context once more.
The market is again showing signs of mechanical action - not surprising given participants’ conditioning to buy the dip eternally, as well as the hot vacuum that is summer trading.
So in these times, the profile can be an even more reliable guide.
Poor structure in the form of gaps and single prints is indicative of price discovery, with prices moving rapidly and players caught out of position.
Image 2. Notes on the week
This week was a textbook study of poor highs and lows, and buying and selling tails. These are easily identifiable even with candle charts (use the 30m timeframe), and are one of the major clues unfortunately overlooked by traders during cash sessions. This is why you always mark them on your charts.
Image 3. Excess and poor high marked on a 30m candle chart
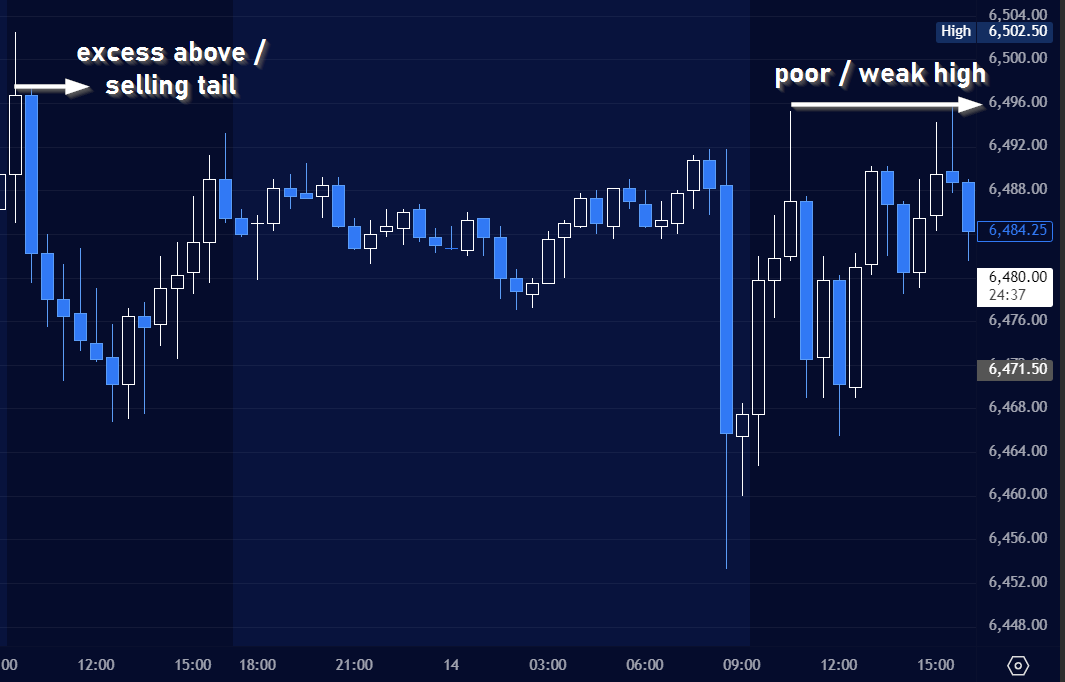
In the example above - note how the sellers (in the selling tail) put up a defense on the following Thursday session (we’ll look more into this below), which should have been a clear short in C period for 30 points with minimal risk.
For example, I rarely risk more than half of a selling / buying tail if leaning against the tail base.
I use Sierra Chart in my examples. This is my default trading platform. However many other services and software have volume profile and time price opportunity studies. If you have any questions or even tips for other followers, leave them in the comments below.