
Using the Profile IV
Context Matters!

Another look at using the market profile as a powerful tool. This is at the core of my daily planning and identifying levels - in this lesson we will look at context in the daily profiles that inform trades and guarantee favorable outcomes.
Image 1. Zoom out.

The Market Profile
Recall the study guide from CBOT. Yep, you can find it for free at that link, no sign-up necessary.
I’ve begun presenting tradeable examples using the market profile, hopefully demonstrating its utility as a powerful (and simple) tool for clearly defined risk and entries. As well as targets.
It’s an elegant representation and use of normal distribution - found in biology, physics, and birdbrain collectives! This is fundamentally why these are repeatable concepts - they are nature by definition.
In this lesson, we will look at fades. I had many traders request some examples relevant to this topic this week. They were consistently caught shorting strength in what is one of the most remarkable rebounds in the history of the indices. Don’t stand in front of a train.
Image 3. Sometimes, the universe just happens

Don’t be a birdbrain - use the profile to your advantage. Let’s check this out.
I use Sierra Chart below. This is my default trading platform. However many other services and software have volume profile and time price opportunity studies. If you have any questions or even tips for other followers, leave them in the comments below.
Be an Expert Fader
Image 2. ES market daily profiles, May 4 vs. May 5
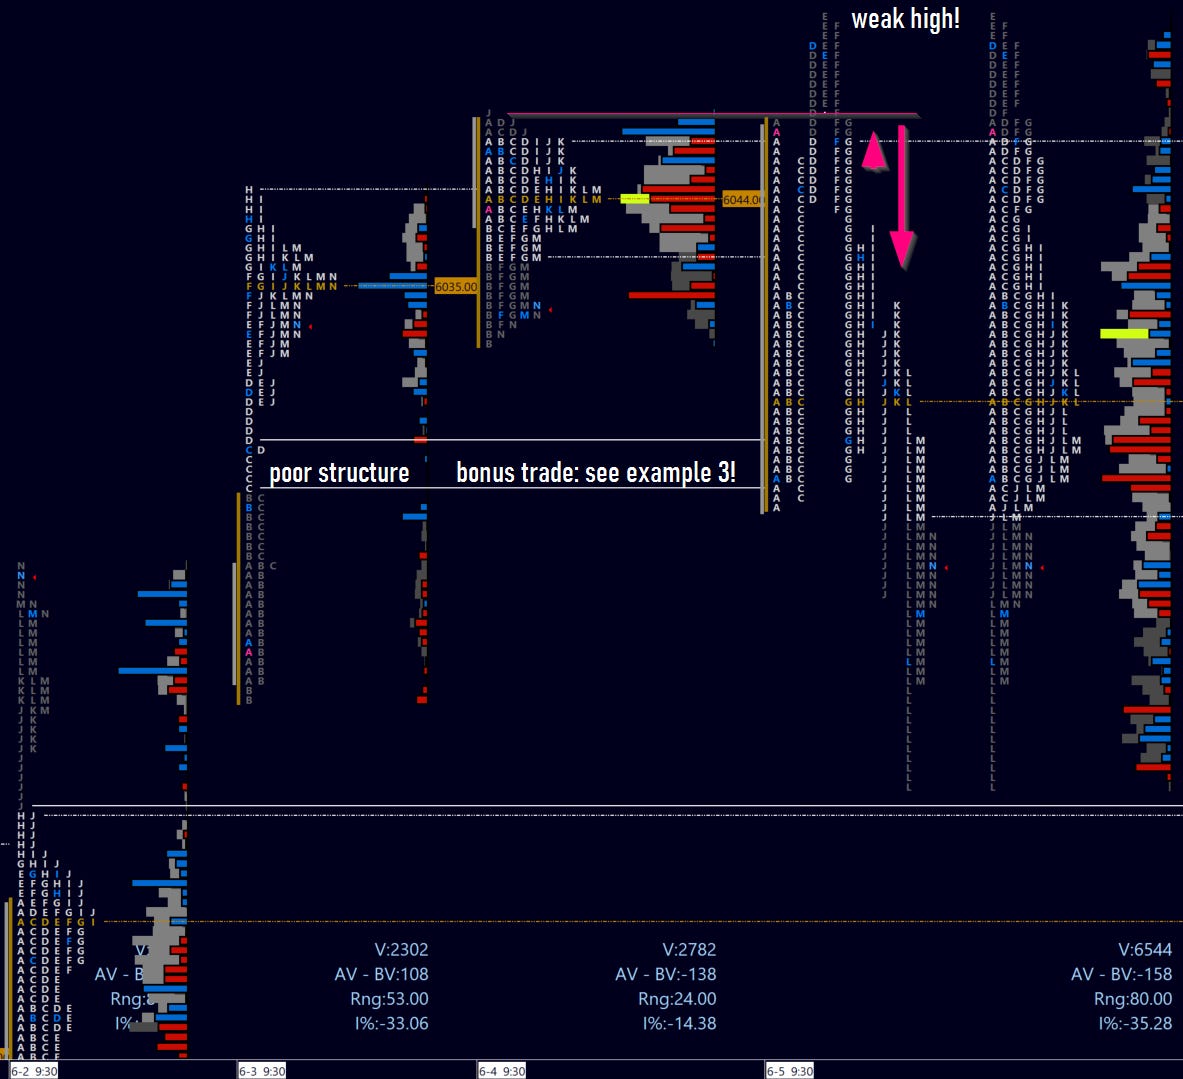
Thursday, May 5. This was initially an open-drive session to the downside, but following three periods of no follow-through below an area of prior poor structure, buyers stepped in.
Our fellow short traders were trapped and disappointed, and many were churned attempting to re-short the index on the way up. The key was patience, and a structural reference to lean short against.
Ideally, buyer strength would see sustained progress above the prior day high, potentially allowing a long into close. Weakness however, could potentially trap traders, this time on the long side. Beware of spending too much time and volume at new prices with no movement. That’s often a lethal combination.
So what happened here that was out first clue? Buyers were arguably strong, but left a weak high in F period. We should be on alert at this point for a possible fade into close.
F period then takes out E and D period lows! This is definitely very weak, and my interest in a possible short is very high. I would then look for a concrete structural reference to lean against. How about a period mid? Or a prior daily high (PDH)?
Why not both?
The G period opened and attempted a rebid, but only made it two points above the prior day value area high (VAH) and a point short of the prior period mid and PDH. As we were already predicating a short thesis, the entry was straightforward, with a stop likely two points above the mid of the prior F period.
Targeting the intraday NPOC, the VAL, and beyond for runners - this was a hell of a trade.
Now let’s see this concept’s consistency, and prevent you from those mediocre shorts!