
Using the Profile III
May 19-22, S&P500 (ES)

Another look at using the market profile as a powerful tool. This is at the core of my daily planning and identifying levels - in this lesson we will zoom into specific clues in the profile that guarantee favorable outcomes.
Image 1. Don’t get too emotional. Whistling Wolf, 1937. (Tex Avery)

The Market Profile
For those of you not familiar with the market profile, I highly recommend the gold standard study guide from CBOT. Yep, you can find it for free at that link, no sign-up necessary.
Regardless of your trading methodology or preferred tools, the market profile is fundamental to understanding price action. For traders just starting out, it helps distill and make sense of all the noise contained in candle charts.
Furthermore, I suggest key strategies using only this tool to my students.
This week we return to the market profile, as the last few trading days were excellent examples of keeping it simple. With information contained in the profile, a few intraday trades were able to return an extremely high risk to reward (R:R) with next to no drawdown. These are the kind of trades that help you relax and thereby extract the most amount of money from the market. We’ll take a look at these below.
Calm trading is critical for profitable trading.
I use Sierra Chart below. This is my default trading platform. However many other services and software have volume profile and time price opportunity studies. If you have any questions or even tips for other followers, leave them in the comments below.
Image 2. ES market daily market profiles and major clues (May 15-22)
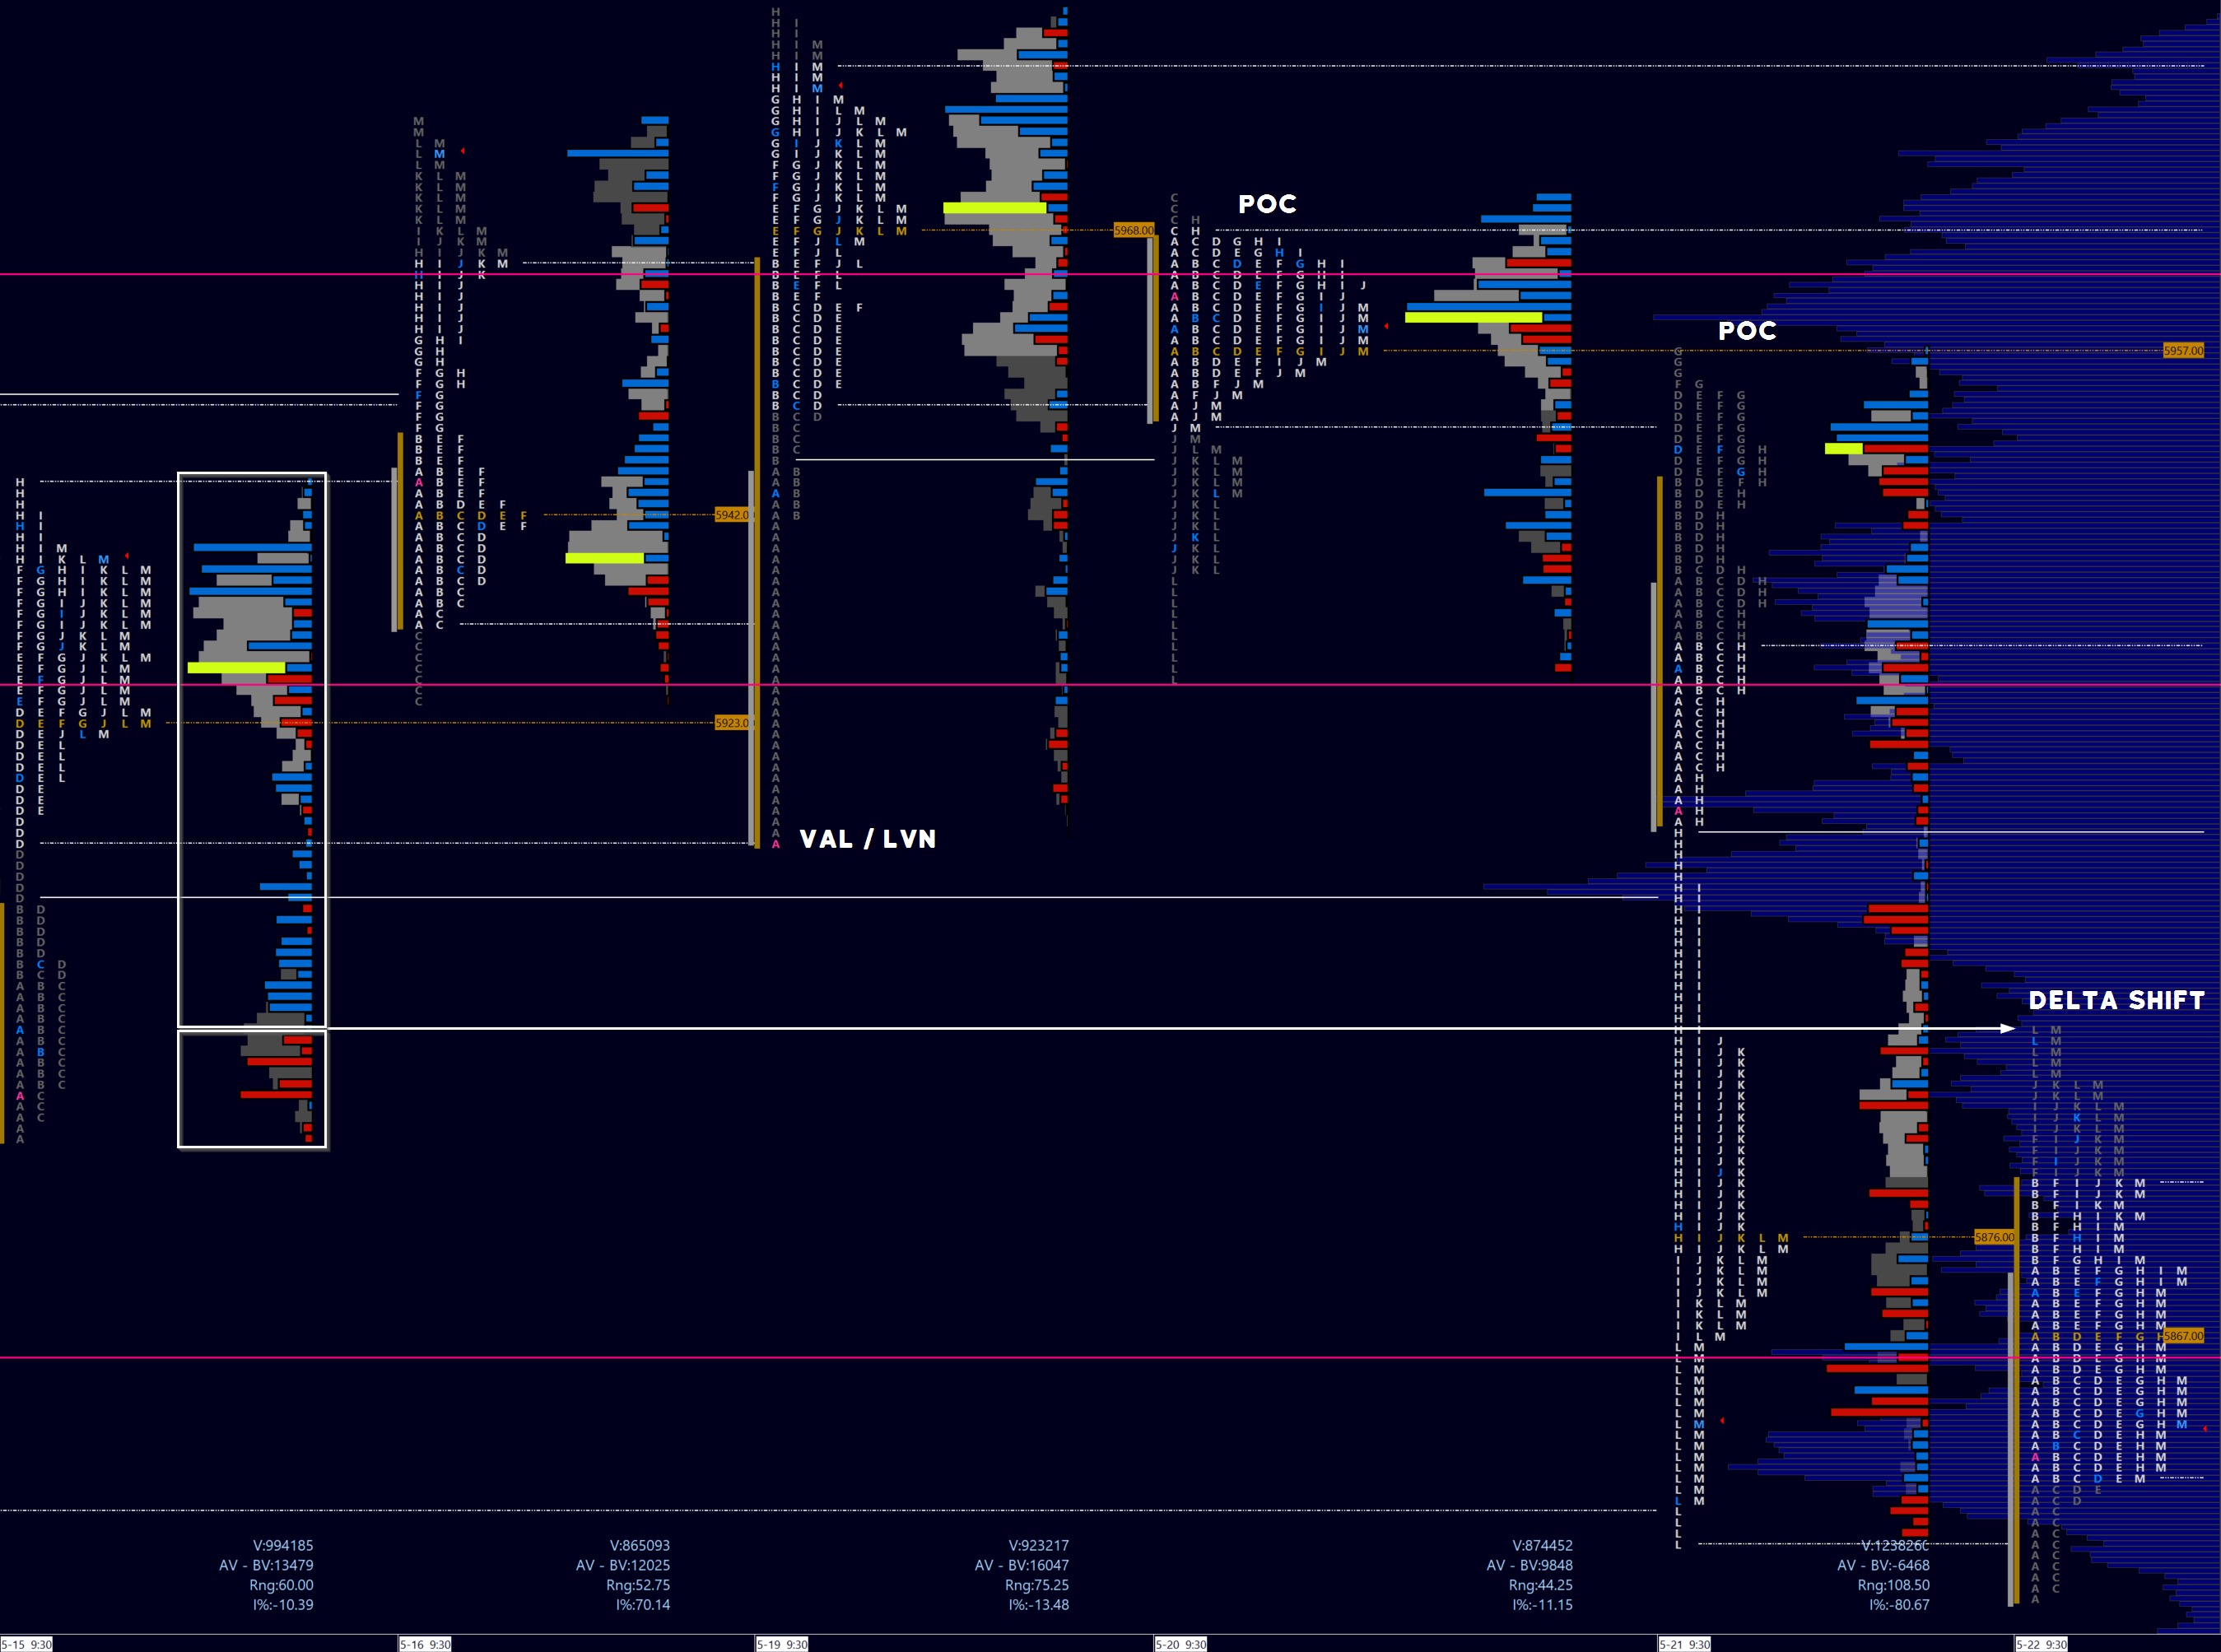
I intentionally left off price on the chart above. This is to say - price is merely the advertisement, and not the thing what you should be trading. Structure and/or setups are far more important. Refer to this chart above for the days in review.
We will zoom in on key definitions with clear examples from above, as well as potential trades in only using the profile. You can then use candle charts to refine your entry and define risk.
Monday, May 19. This was a classic' ‘open-drive’ session, with almost no look below at the open.
Two profile clues from a previous trading day were present ahead of the open - we were already below the prior day in the immediate pre-market, however I was alerted to both Thursday’s low volume node (LVN) coinciding with the value area low (VAL - white letters) and point of control (POC - the orange letters). I extend these in Sierra Chart for convenience, but you can just as easily draw them out manually.
The thesis was thus - a hold or open drive of Thursday’s value area and a quick reclaim/retest from above of the POC would bias trading to the upside.
Image 3. Monday open, 1m chart
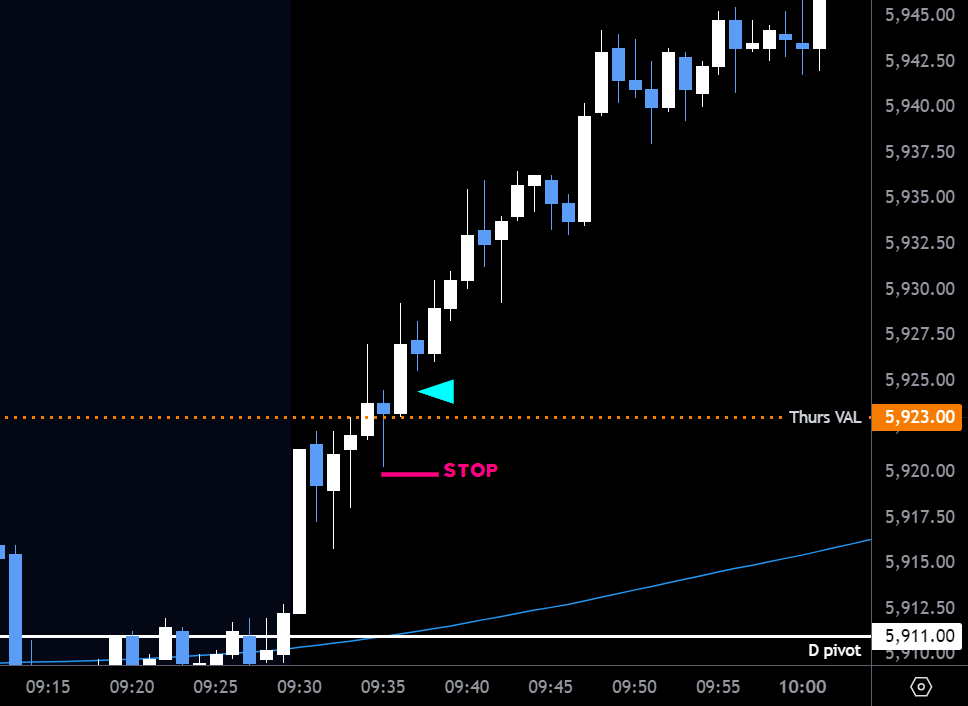
Take a look at the one-minute chart above. This was an aggressive open-drive: I often zoom in to a 1m timeframe at the open or for rapid price-action at key levels. I had Thursday’s VAL marked, which was tested at 9:35. Note the hammer candle which was bought up. This was my prime entry, joining into the offer with a stop below the hammer.
Tuesday, May 20. An incredibly frustrating day for most traders. However for users of the profile, the price action became clear in the afternoon. It led to a great closing trade.
So what was going on? Let’s expand the profile first.