
Trading Tape: High Conviction
Poor Structure: August 8
Each week I review key moments from recent price action in the indices. These instances will be analyzed using three methods: the tape / DOM; footprint; and candle chart. Synthesizing the three allows an understanding greater than the sum of its parts, leading to a complete understanding of the auction process. There are many great resources out there, although I am not aware of any that provide such a comprehensive study guide.
Image 1. Works every time

High Conviction
Poor structure is often filled, and in my backtesting it is especially relevant within a five to ten trading day window (with 6 days the median) for a revisit.
Some days happen back to back, but the rules still apply:
If we open within or see IB trade into the area of poor structure, chances are that an early revisit and reject of a key reference (like a VAH/VAL, or buying/selling tail) will see half, if not all, of the day’s trade filling or retesting that area.
Likewise, a break and IB close within prior value more often sees a tag of the PDPOC, continuation to the other value extreme, or even continuation in that direction.
An IB close outside of the prior day range likely sees further price discovery.
Image 2. First half, to E period retest of PD poor structure
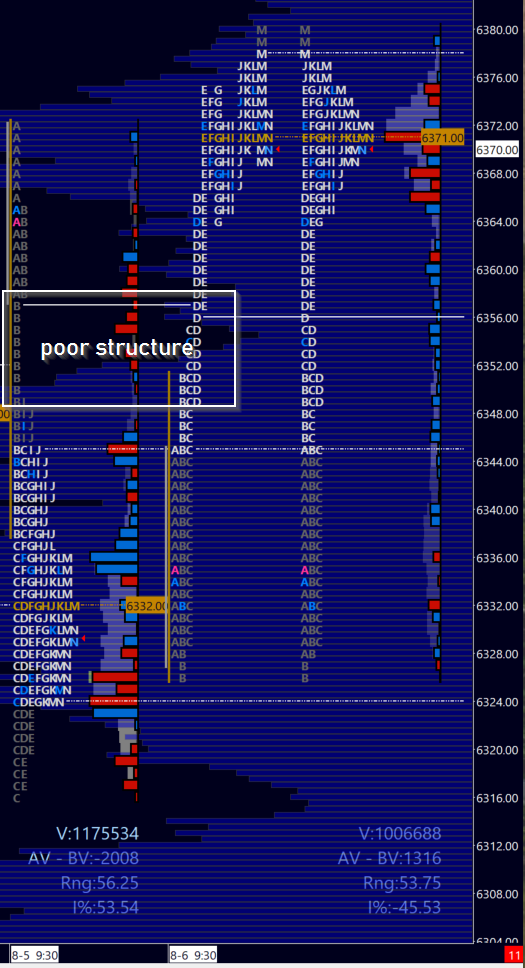
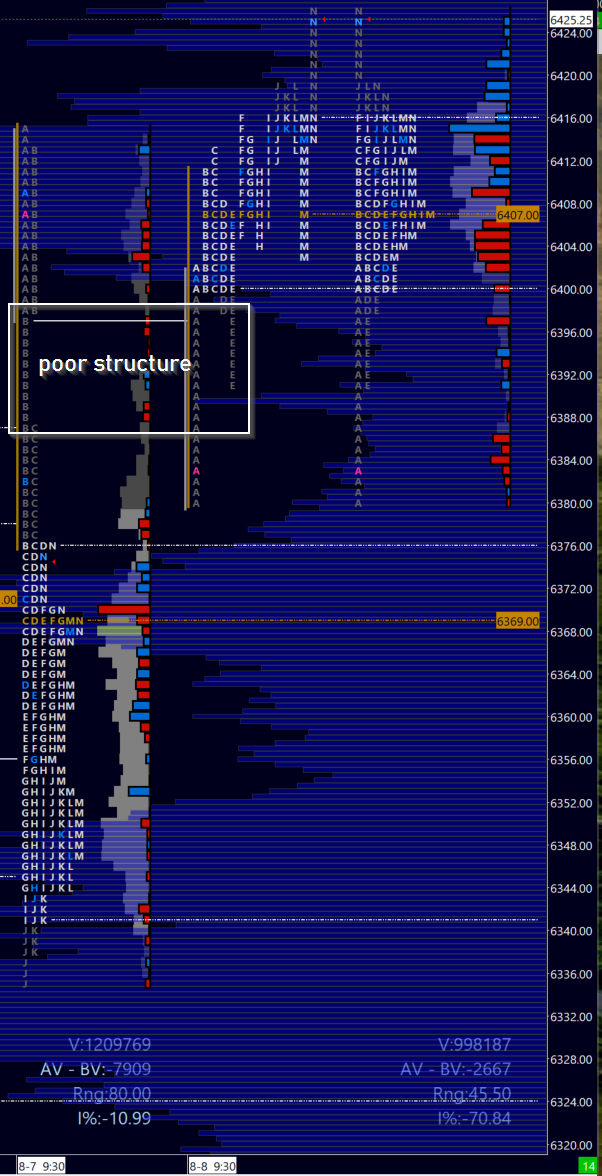
Image 3. The day in review - same E period retest!
Of course, this is a general guideline - and it has worked better when markets see more two-way trade. Case in point - we are in a larger multi-week balance area. Thus our two examples above.
Which makes sense, as highly directional markets (all of Trump 2.0 so far) fail to revisit older areas of trade. And past a certain threshold (largely that 10 day window), areas become less reactive. Although still relevant to mark on your charts.
Nonetheless. I like these trades as they are fairly predictable, especially if mechanical references like the exact levels of poor structure, a daily high or low, or prior VAH/VAL are tested and react. This was my read on the open-test drive setup this Friday. Setting up a higher conviction trade.
Let’s take a closer look with a candle chart, the market profile, and finally a screen recording of my trade entry and management. I will note three key moments that paid off as a great trade.
August 8, Prep and Setup
I always trade with a reference candle chart, with my homework the day before to identify key levels, pivot, and areas of interest. As well as areas where I think market tone may shift.
You should do this each day before the open.
Excuse the typos, these are not intended for presentation.
Image 4. ES 5m chart for daily prep
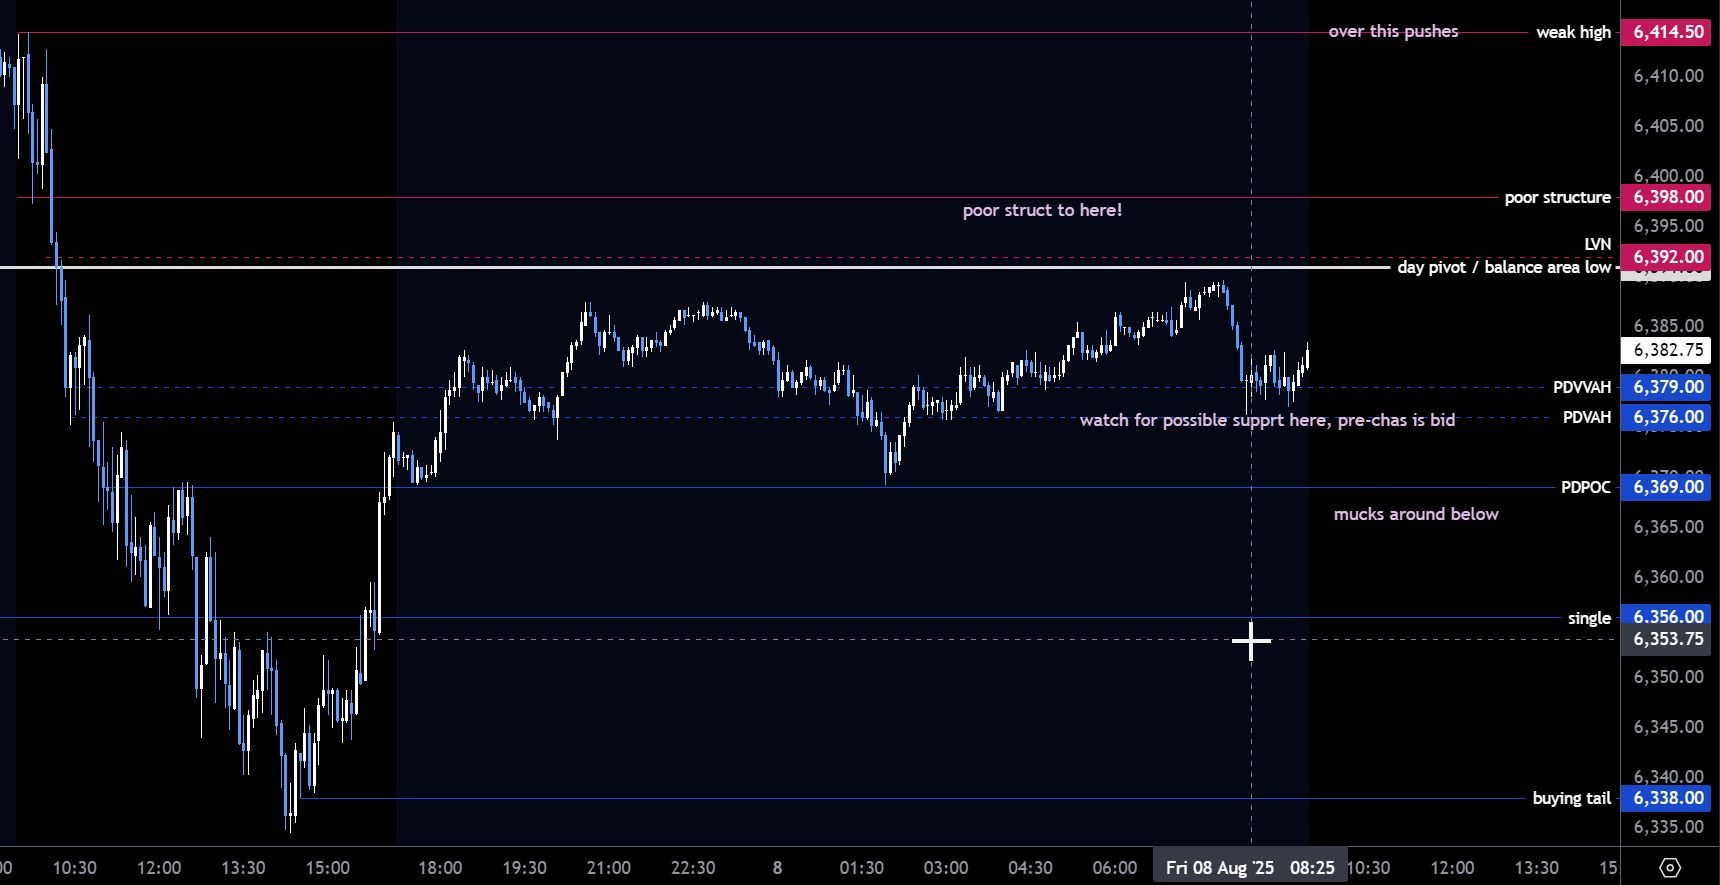
Already I have a key support level for any longs in mind, which I often squawk about on my Twitter (X):
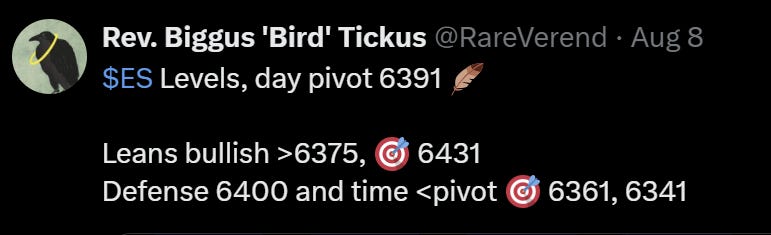
Image 5. Crow Twitter feed, August 8.
This was looking at the prior day profile value area high and volume value area high.
So now you know.
On to the good stuff: the market profile. I had key references in mind, from the chart below. So now I have a basket of clues and important levels: