
Trading Flushes
The King Killer

Loving a shakeout for what it is.
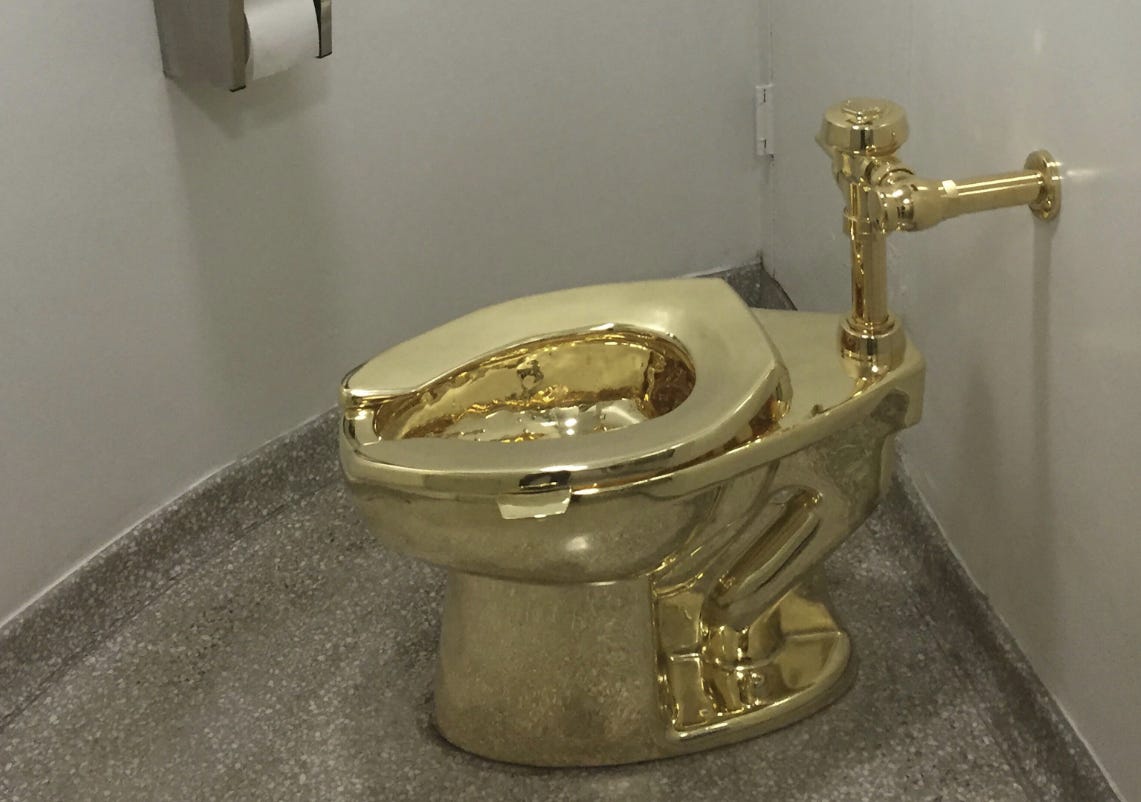
Image 1. The golden flush
A trader I’ve known for many years recently sent a question that I see too often:
“How do I not get scared out of a flush?”
First of all, that’s the wrong question. If you are in a trade and considering your fears during a price spike, you are either a) past your stops, or b) never had stops.
So…stop. Set up your trade parameters first. And you can always get back in a trade with a good setup if you’ve already been stopped out. Heck, you might even have a clearer reference now (a high or low). Let’s look at two examples on one day, and the patterns that emerge on “liquidity grabs”. And yes, these are generally some of the most profitable trades, with clearly defined risk!
Market Profile Context
Recall the study guide from CBOT. No sign-up necessary.
We’ll be trading Wednesday, January 14 in this lesson. First let’s look around for context using the market profile.
Image 2. ES weekly and daily profiles
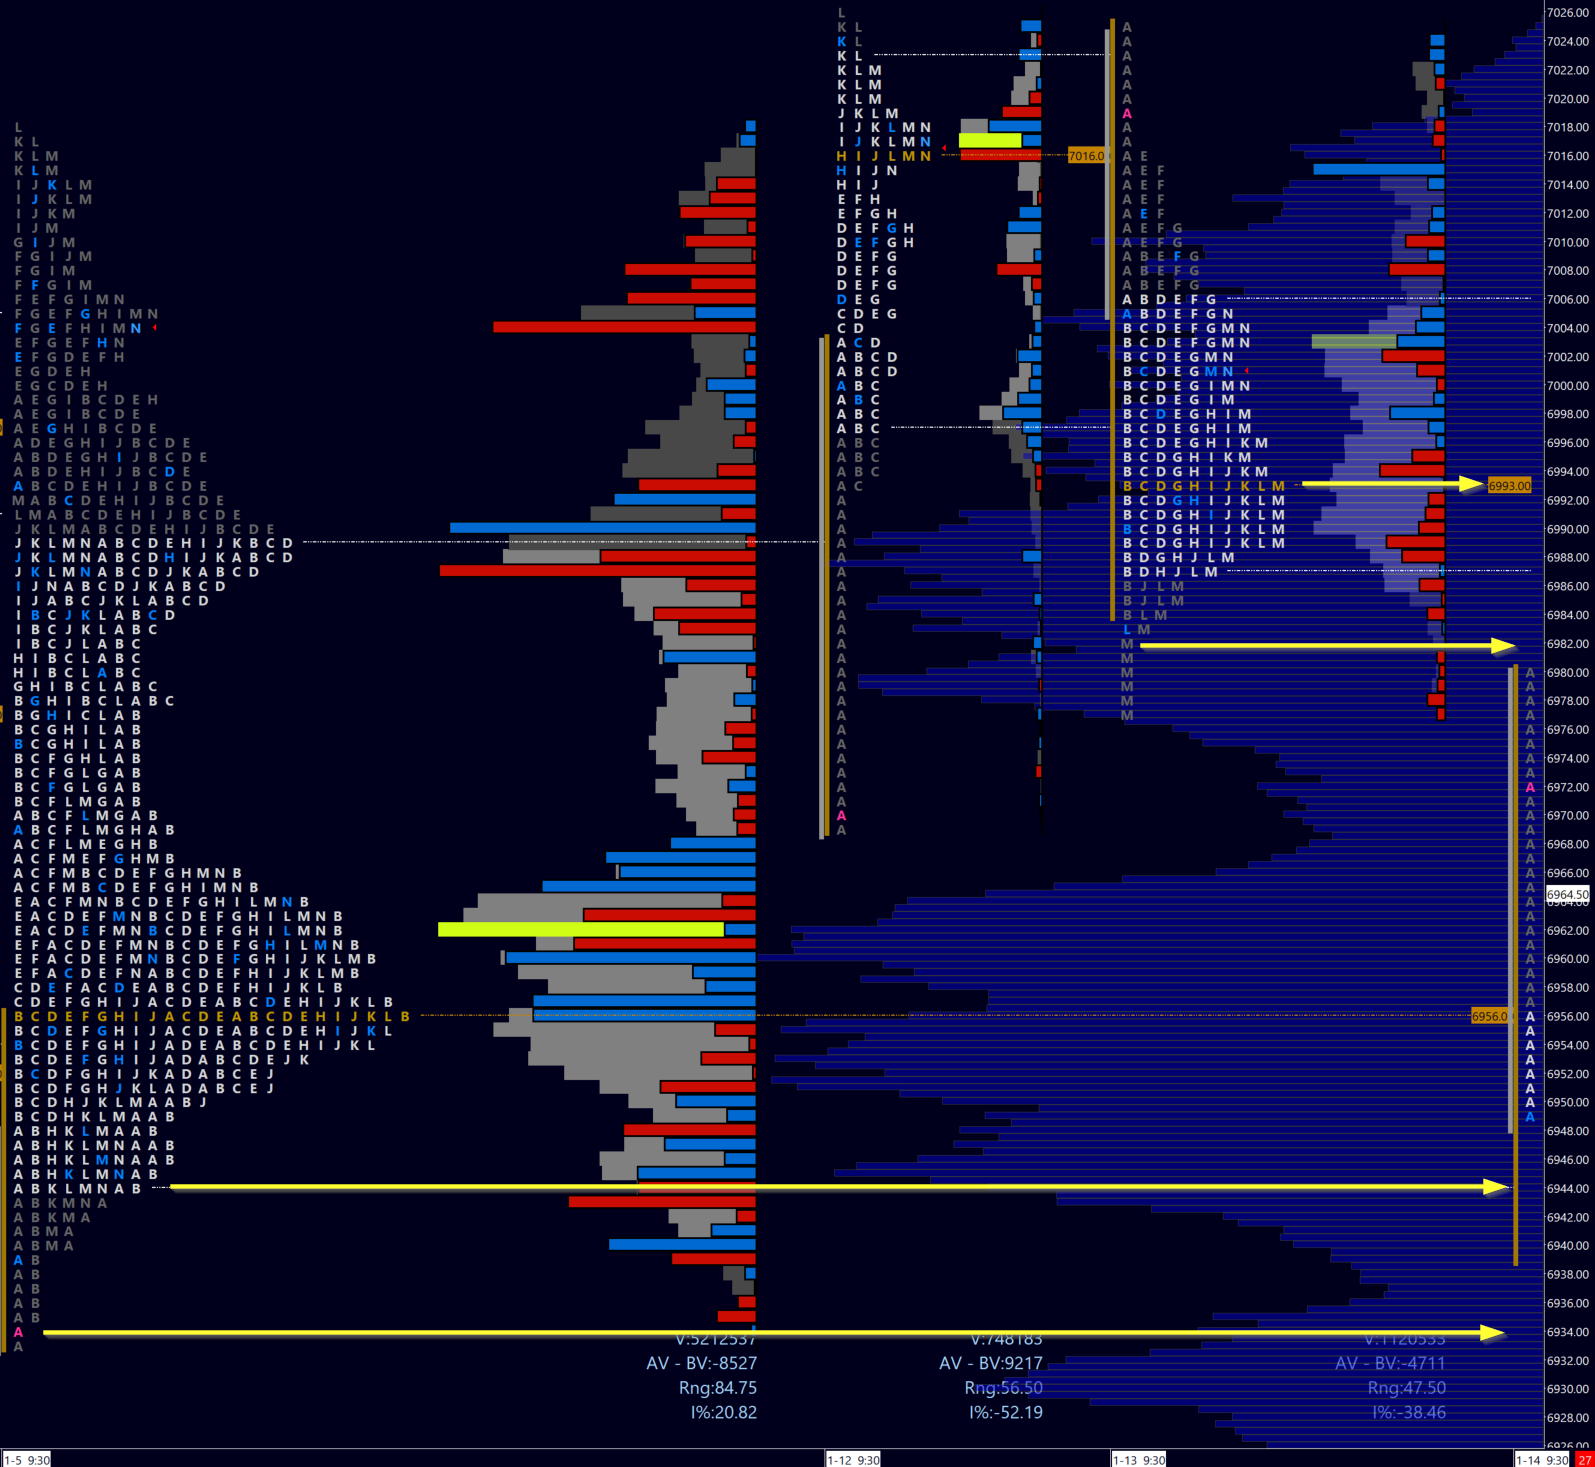
Above the opening level (pink ‘A’, I have the entire 30m opening range printed here) are the prior day buying tail and NPOC. Standard references.
Below that I consolidated the prior week’s trade into one profile as we were in balance. I’m not exacting with these levels but I take note of the prior week VAL and weak low.
Image 3. Wednesday January 14 5m chart
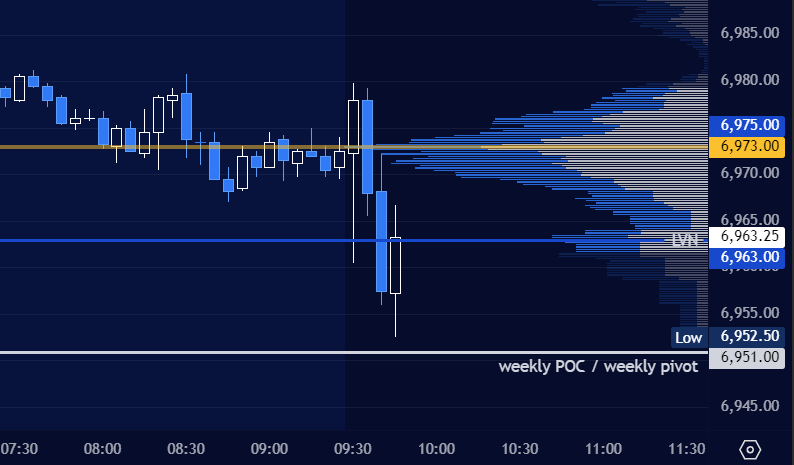
We open above the weekly profile with a burst upward, but never get close to the overnight high. Sellers readily come in so I’m favoring the short side, but anticipating a bounce at the weekly POC. So I stand aside.
Image 4. ES 5m candles
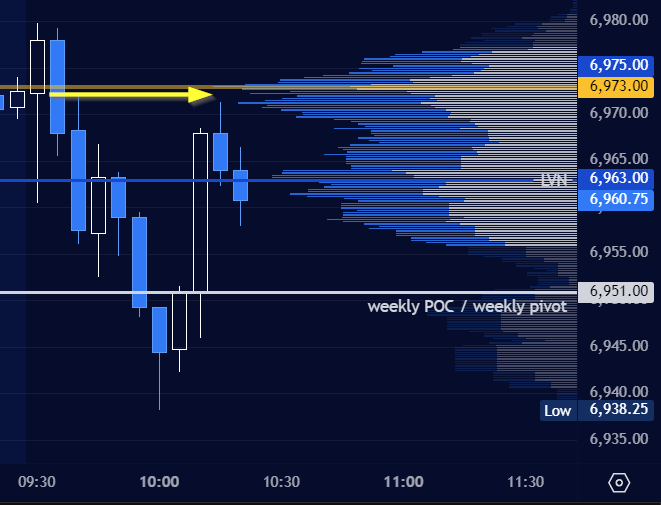
It was too much momentum for me to chase on the short side even though we cut through the weekly POC. The bounce came anyway - and I was now looking to the day’s open (arrow above) for a lean. It’s the footprint that gave me confirmation to fade the liquidity grab!
Image 5. ES 5m footprint chart
What am I seeing here? And how do I use a simple candle chart to enter a killer trade?