
Trading Course: Reading Market Profile
Turning letters into tradeable stories.

Image 1. A bottle opener? A stork? Nude 6, M. Stibor 1967

A number of traders have asked me how to interpret market profile, how I identify levels, and how I to use them to identify trades. All this content - and a lifetime of trading experience - can fit in a few books and then some. For now I want to use last week as an example. It’s far from comprehensive but it will demonstrate how a narrative can be formed by listening (or reading) to what the market is telling you.
I hope to communicate this content clearly enough that you may begin to understand how to apply the market profile in your own trading, or incorporate it into a system you already use. In essence profile is a condensed price chart, revealing the distribution of prices over the course of TIME. Remember, time is probably the most critical factor in markets, more so than price. Price is the advertisement, time is the regulator. What?
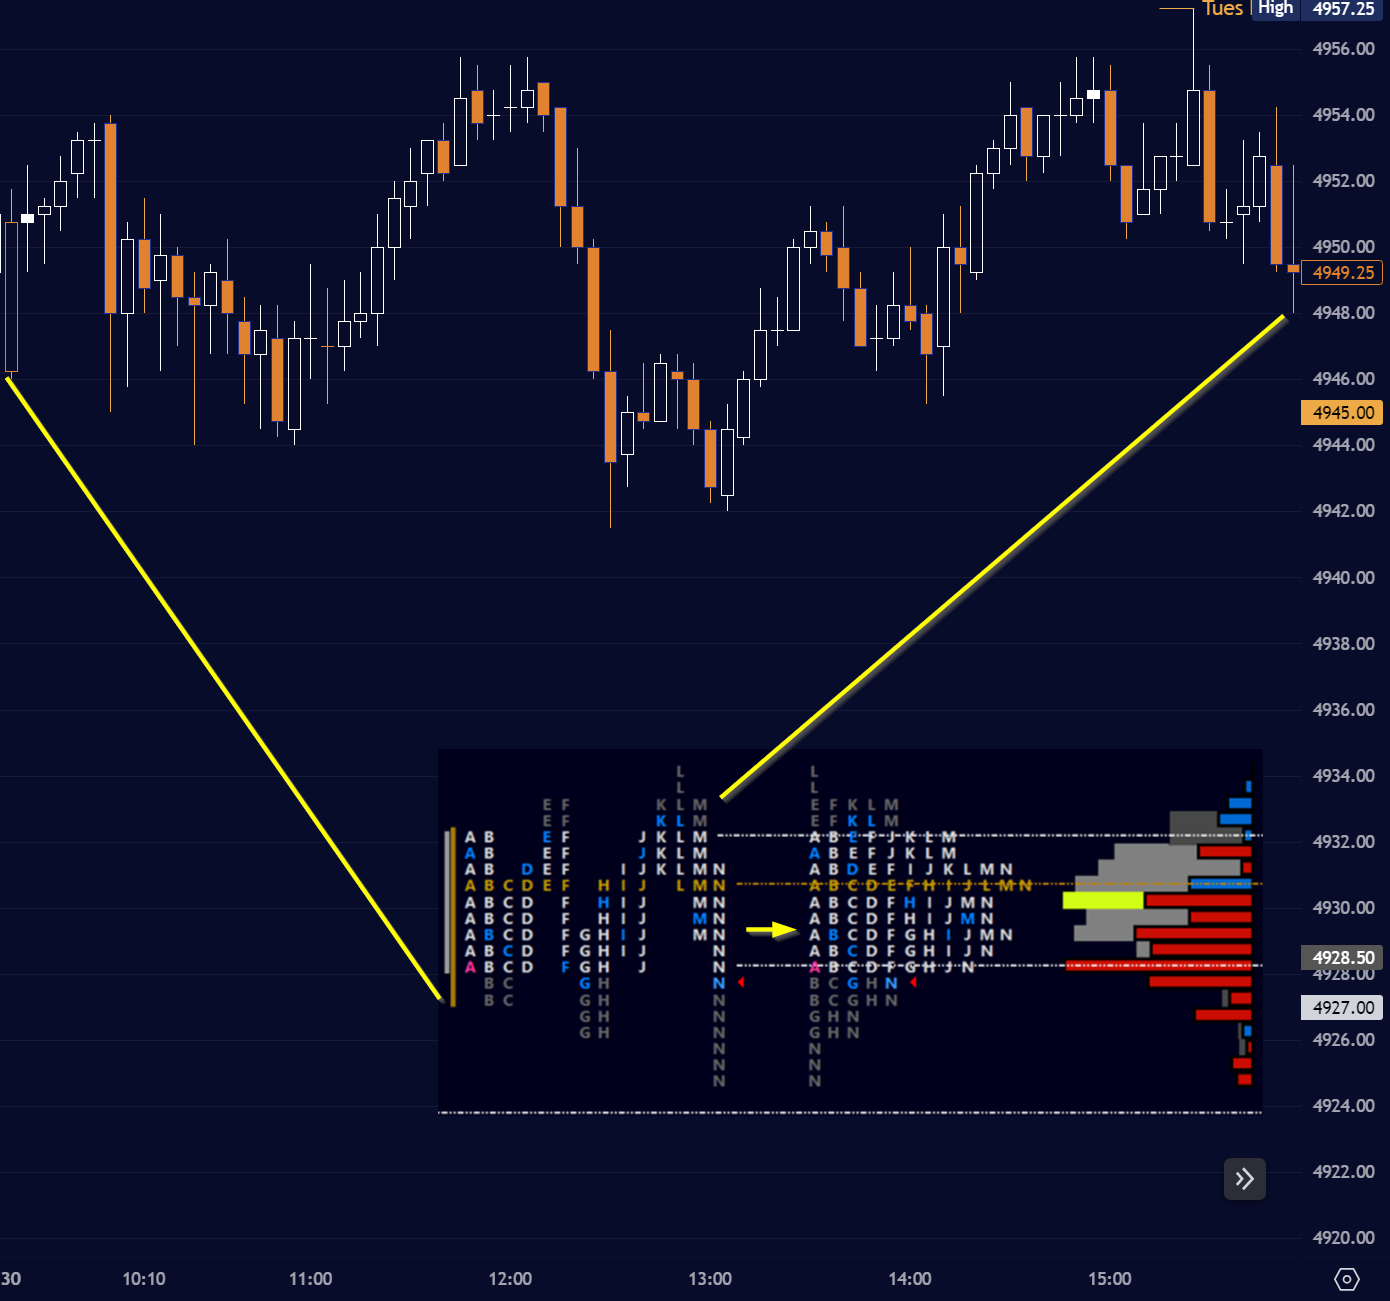
Image 2. The making of a market profile, Tuesday Jan 30, regular trading hours (RTH)
Thank about it - if today your eggs cost $5 and tomorrow it jumps to $10, you’ll be outraged. How dare they! What possibly happened to the chickens overnight to justify this?? Are these egg barons crazy, I will never pay this!!
Six months later, you accept that’s just what eggs cost ‘these days’, grumbling as you fry an omelet for your kids. If it went back to $5 overnight, you would be surprised and may even think, what is wrong with these eggs? Are they a bad batch or diseased? Did ‘country X’ flood the market? Should we abolish NAFTA? (yes)
I appreciate the DMs and requests for more educational content on how I trade and interpret markets. These write-ups take a lot of time, research, and a lifetime of mistakes - some followers have suggested I set up a subscription tier in the future to encourage content like this. For now, I do appreciate you reading and supporting me through ko-fi, or dropping off a carton of non-diseased eggs at my door!
The Week of January 29 to February 2 in Profile
We will look at the week as a whole then zoom in to individual days, shaping the story from the clues available to us. I will not be covering extended trading hours (ETH) as this will be confusing for now. This will require an additional set of content as well!
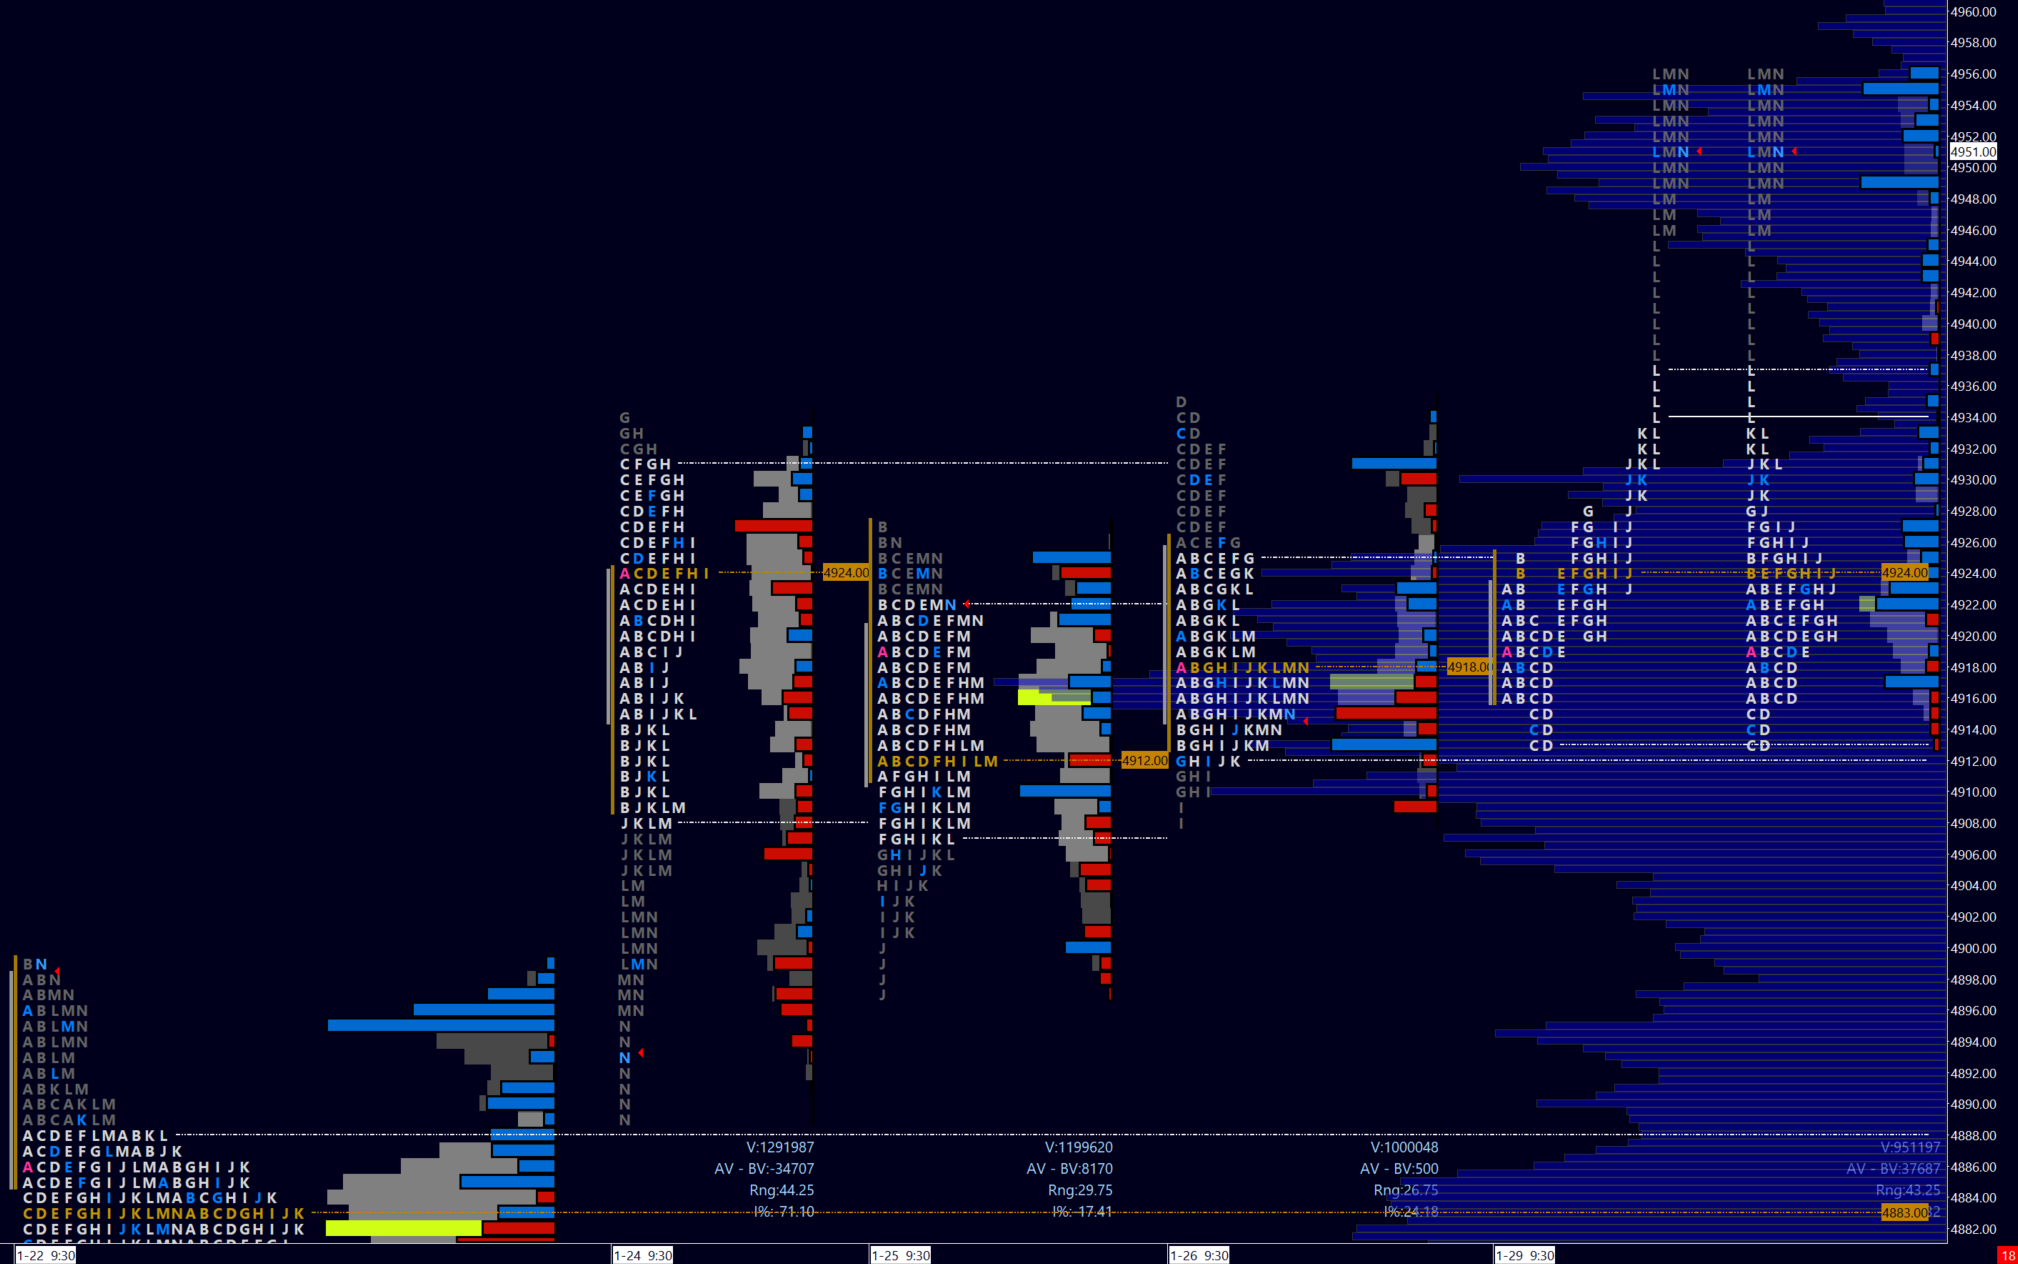
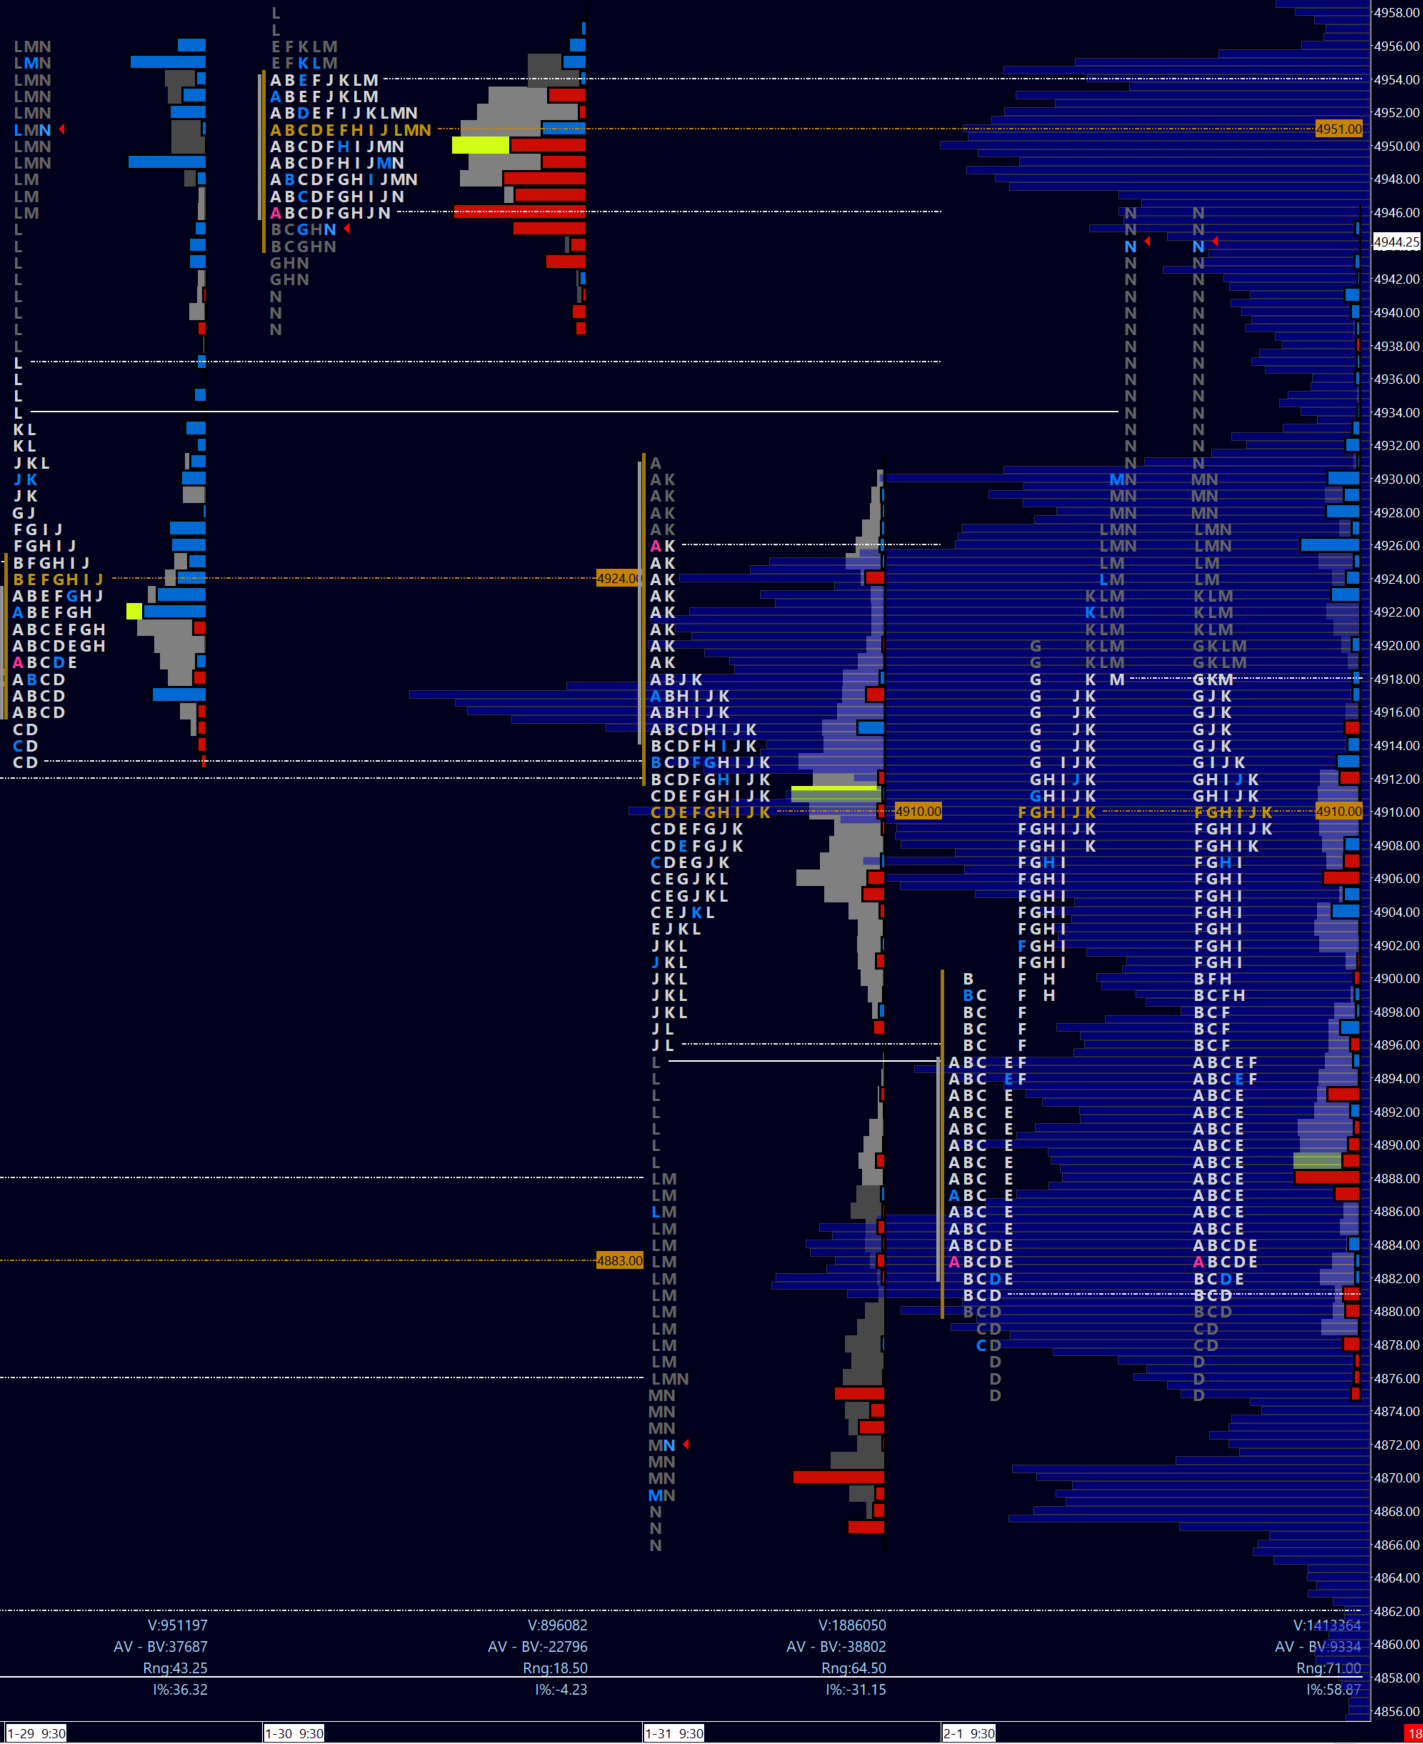
Image 3. Week in profile. Click to expand
I will approach each day systematically, keeping the narrative as succinct as possible. As with a dozen indicators on a chart, too much overlapping narrative leads to confusion. As day traders you likely want to capture the bulk of a move and not sweat every little movement or detail…but what if the patient sellers want to hold out a little more here? Is there more short covering here than new buying really? Is this an algo program? Just how short-term are the short term traders? How much wood would a wood chuck chuck? See what I mean.
By the time you’ve approached something like an answer, the market left the platform 12 points ahead of you.
Each day in review will look back to the preceding days of the week. The day in review will have an expanded profile with letters in their own column to give you a picture of the day’s action (a print for each price traded in a half hour period; a time price opportunity, or TPO), prior days will only have a profile to keep it simple.
Because we are interested in what clues the prior profile reveals to us regarding a possible thesis for the day in review, we have to ‘pretend’ like we haven’t witnessed the current day’s action yet. We will only use the day in review to explain the action against our thesis prepared in advance. Many successful traders do this daily, adhering to the thesis while respecting stop outs and targets.
In Monday’s case it will be daily profiles from the week prior. I keep in mind all days of the current week as it progresses, although sometimes on volatile weeks it helps to look back further to the weekly and monthly timeframes for a bigger picture. It’s like hiking - you want to know where you are in relation to the mountain, river, or cliff, but ultimately whether you climb, fall into one or fall off the other depends on looking immediately around you. And you also want to make sure you aren’t completely lost and in another province entirely.
And yes I once did hike from Italy into France by accident, not realizing this until I walked into a local shop. This is not a joke. Luckily I speak French (better than I speak market sometimes).
1. Monday, January 29
The prior week was characterized by three days of balance heading into the weekend. The question going into Monday was either a break of balance up or down, or more balance. A rejection of the extremes of highlighted value area (within 70%, roughly 1SD on either side of the mean) could lead to rejection and a traverse of value - and possible break to the up or downside. Value was building higher so it seemed prudent to stay with the trend.
The Monday morning thesis was thus to lean on a reaction to Friday’s VAH or VAL. We tested Friday VAH in IB; I thought chances were good for a balance or break to the downside…until we formed a poor low in C and D period. This was a great long signal for another traverse of value - and a possible break. We broke up slowly but surely - the POC supporting J period accelerated momentum / price discovery into upper targets.
2. Tuesday, January 30
With price discovery to the upside, the thesis was based on either a balance or rejection - less likely a continuation. This partially was due to the poor high in L and M period the day before. The prior L period halfback might offer a good long spot, as a market dominated by short term traders leans on ‘dumb’ (mechanical) references like this.
Tuesday’s thesis was a fill of L singles or a break of the prior poor high. Anything else would likely be churn, which I am personally not good at trading. part of good trading is knowing when to stay out. The IB left a poor high, suggesting stronger downside, but this didn’t materialize. Once again a B and C poor low led to a similar and opposite conclusion, only to be met by E and F poor high. What a nightmare! The prior L period mid (another poor low, yuck) did bid per thesis, but the extremely underwhelming break of the poor high in this day’s L period suggested weak buyers.
3. Wednesday, January 31
Here’s an example where zooming out to the river or cliff is important (the prior week). Especially so given volatility expected on FOMC day.
We already expected the gap down in the hour ahead of open, assuming weak buyers from the day before, even more so the breakdown immediately on Tuesday’s close. Now we realize Tuesday buyers met large supply above - and are effectively trapped.
Wednesday’s thesis leaned on liquidation to lower targets IF the gap did not fill. Buyers were not able to fill the gap let alone challenge Monday’s VAH, leading to value migrating lower. A large push on the FOMC data release only shook out weak intraday shorts. But notice how no new high of day was made! The process of intraday shorts liquidating also removed demand (support). Stronger sellers then reemerged to traverse intraday value, totally liquidating intraday and prior day longs, removing all supply in the process. They then covered at the lows, leading to some support into close.
Late shorts expecting a further break now began to accumulate at the lows, but unfortunately adding supply at a less than ideal location.
4. Thursday, February 1
Wednesday late shorts would be an important gauge going into this session. Just how right or wrong were they? We know that the liquidation removed a huge amount of supply above (the shorts covered lower so were now out of the picture), so any failure of further price discovery could lead to strong reversal. Much like Tuesday’s session.
The primary thesis was to watch for a look below and fail, and the prior day L period singles to fill. This would mean that sufficient demand repaired structure, and could potentially trap late shorts from the prior day - sparking short covering into a vacuum of supply. A failure to fill L singles (meaning more supply arriving ) could mean further downside price discovery, the idea being to trade with the break. The L singles filled early on, and the lack of supply became very obvious, especially into the close/settle (N period). New demand clearly emerged into clear skies above.
5. Friday February 2
Thank the market gods it’s Friday. Hopefully your account is intact and you’ve had a good read on the week’s action thus far. One more day to survive - and possibly make money.
We saw very strong buying and short covering into Thursday’s close. Never mind if it was more the one than the other, who cares - clearly there were very little sellers (supply) in the way. This momentum strongly suggested a traverse through Tuesday’s value since we knew those prior shorts covered far below.
Friday was thus a question of rejecting downside to traverse Tuesday’s value to higher targets. Indeed, there was no interest to look far (one, two points?) into Thursday’s prices at the open as selling completely shut off. Buyers met also no resistance as Tuesday’s supply was removed, easily breaking to new highs in C period as whatever few Tuesday trapped longs were left took advantage to get out. The G period gave final confirmation when testing if any sellers were interested at all at Tuesday’s prices. Very few if any, and buyers jumped at the apparent firesale discount. The 5,000 price, not at all far away, was a natural psychological magnet on momentum.
I recognize I’m a small account, but I hope I punch above my weight class. Please spread the word for my content here and on Twitter (X) if I helped you in your trading journey. I am thrilled to share my daily journals with you and in the future I will unpack more trading concepts and add new ones. I hope this review was helpful in describing how you can systematize trading which is the key to success. Plan your trades ahead and respect your stops!
That’s it for now, the market is always open tomorrow.
Tip jar - support my continued work!

Your support and comments are appreciated. I do my best to respond to everyone in a timely way. Be sure to follow me @rareverend on X (Twitter) for the latest updates!
Don’t maintain bias in the face of contradicting information! Capital preservation is key.
Thank you for this explanation. It truly helps. Can I ask what is your thought/analysis of Monday’s single L prints which then turn into LMN? What would you expect for Tuesday or in general of the LMN?
Thank you. Super helpful!