
Tape/DOM Course: Trading Tops
March 26 and 28, S&P500 (ES)
Each week I review key moments from recent price action in the indices. These instances will be analyzed using three methods: the tape / DOM; footprint; and candle chart. Synthesizing the three allows an understanding greater than the sum of its parts, leading to a complete understanding of the auction process. There are many great resources out there, although I am not aware of any that provide such a comprehensive study guide.
Image 1. Duck hunting

Moving Tails
Examples from the tape. In this series we explore the three primary concepts revealed in the tape, footprint, and DOM with regard to ‘turnarounds’ in the price action: absorption, exhaustion, and counter-initiation.
This time:
“Don’t look for the top, let others find it for you.”
We have two stellar examples of opening exhaustion leading to a steep sell-off this week, netting over 100 points in one example.
I will be returning to video replays for this series. The lesson will focus on the tape and footprint, using a playback of two times normal speed. Ideally replay is done at 1x speed. For the sake of learning the rhythm of the tape and price action, as well as the sake of time in this lesson, some speeding up is fine.
In the series below, I will identify key moments of price action using time stamps, with a brief description of the dynamics at each turn - as well as tips on how to trade them. I took entries in these locations on both days - one using puts and the other futures contracts.
I used the price action for my entry cues.
March 26, Trading a High
Video 1. ES 5m footprint and tape, March 26
9h36:30. Absorption is clear as buyers are not rewarded by much upward movement despite their efforts. The tape is slow at the open of the day, and with few large trades into the offer - little blips that fail to move price. Buyers are not strong.
9h38:15. Sellers step aside as buyers attempt to initiate to the upside - but note the sparse buying volume into the offer on the tape!
9h39:00. Goes without saying, a much larger seller takes out hundreds of lots into the bid. This is followed shortly after with a large order of about 250 lots into the offer that pushes price up - but coincidentally is sold again for nearly the same size at the top tick. Large hands are ‘goosing’ the tape. If these are real buyers, continuation should follow.
9h40:00. Buyers once again attempt to initiate to the upside, but note slow action of the tape, as well as no significant order size into the offer. The amount of red on the tape is similar to the blue even as price moves up, a key indicator of active sellers taking advantage of higher prices.
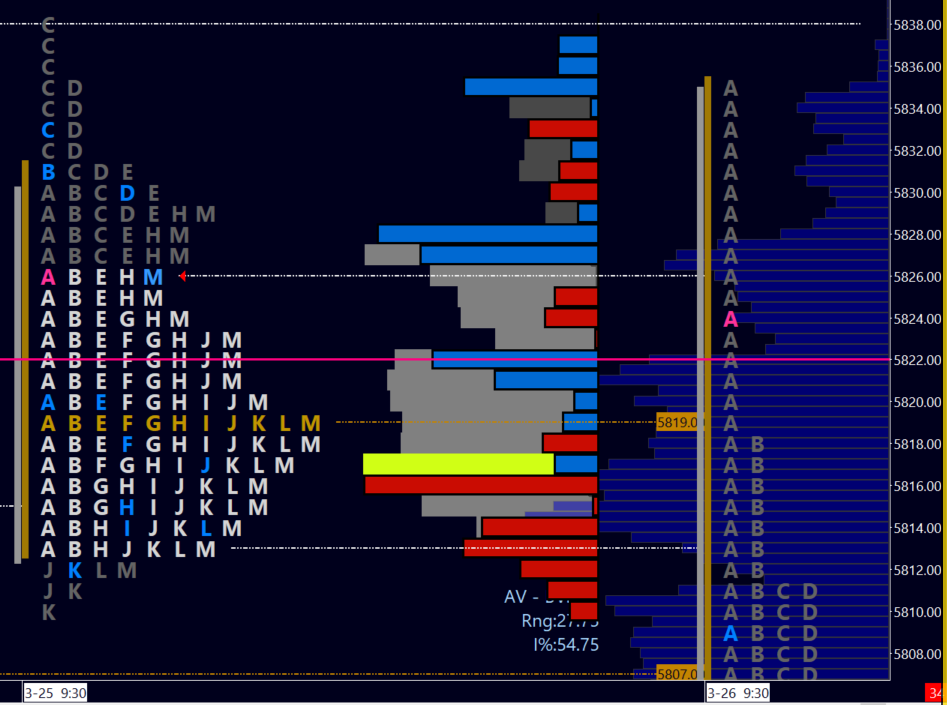
Onto my thesis for the day: key for me was the reaction of sellers to defend the selling tail from the prior day. I wanted to see at most a look above and fail of the prior day high, or price action fizzling at the selling tail base as a confirmation of weakness and a possible short trade.
Image 2. ES daily profiles. Prior day selling tail.
9h41:20. Buyers are now showing clear signs of exhaustion as price slips. I will likely be looking for seller counter-initiation followed by a weak buyer rebid to sell into.
Any weak attempts into and above 5832 may also present an early opportunity.