
Tape/DOM Course: Trading Pivots
April 14, S&P500 (ES)
Each week I review key moments from recent price action in the indices. These instances will be analyzed using three methods: the tape / DOM; footprint; and candle chart. Synthesizing the three allows an understanding greater than the sum of its parts, leading to a complete understanding of the auction process. There are many great resources out there, although I am not aware of any that provide such a comprehensive study guide.
Image 1. Should I do it anyway

The Power of Pivots
Examples from the tape. In this series we explore the three primary concepts revealed in the tape, footprint, and DOM with regard to ‘turnarounds’ in the price action: absorption, exhaustion, and counter-initiation.
Below is an excellent reason for exercising patience intraday. The opening range and initial balance were extremely volatile, and a level to lean against could be elusive. The 5500 level would be a key psych reference, however price fell a few points short.
I was personally watching 5479-80, which I shared on my feed as an intraday pivot. Why was this? Let’s take a look at an hourly chart!
Image 2. Establishing a pivot
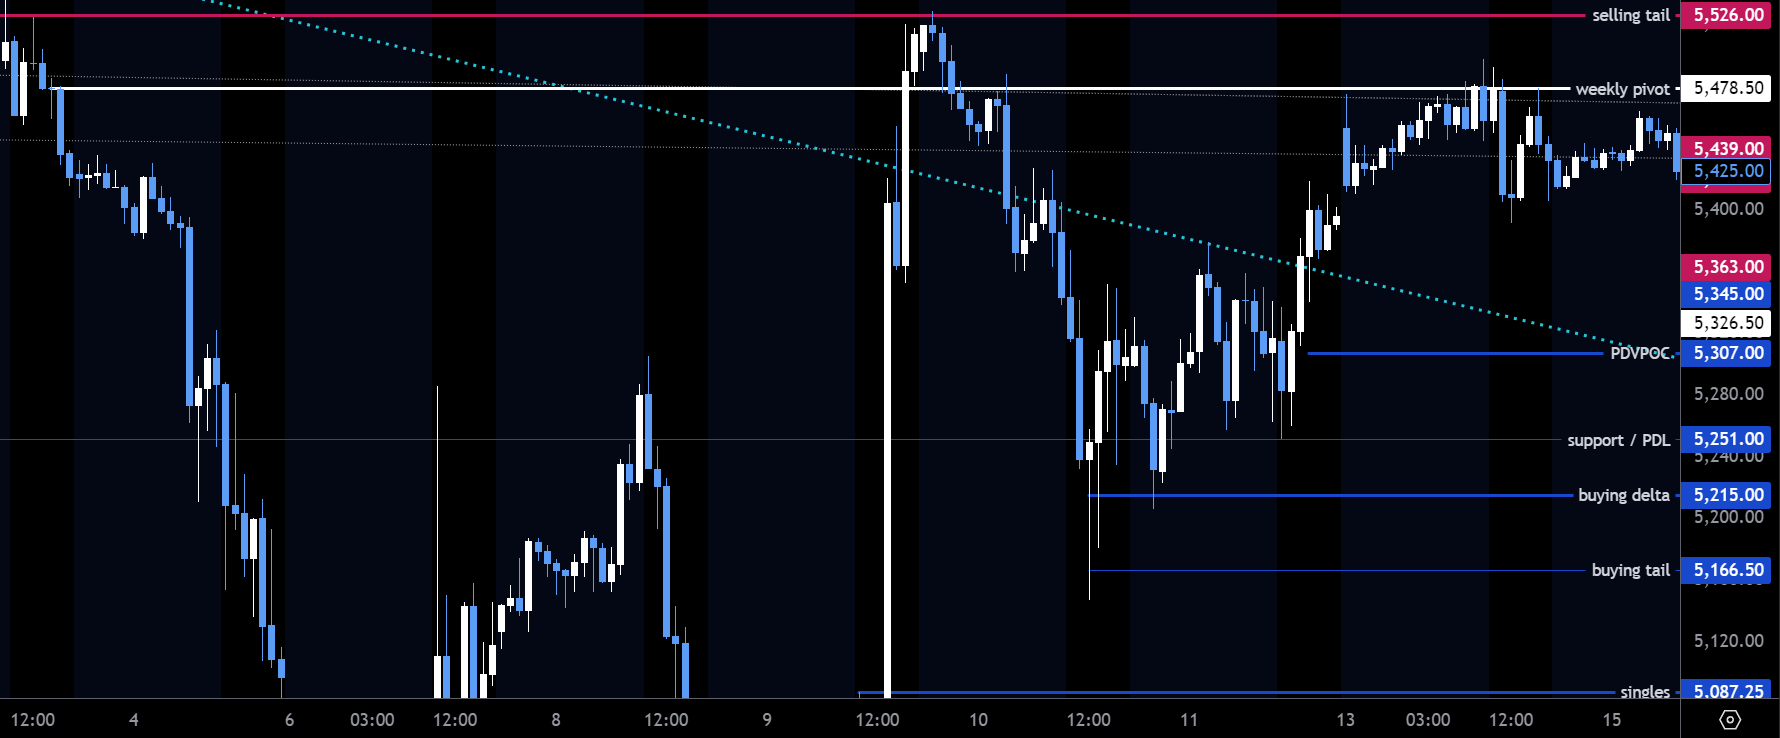
I considered 5479-80 a critical fail point in early April, which opened to an over 600 point sell! A week later saw a rapid recovery into this level; however support was only found in the ETH session. This brought my attention to an unresolved level - meaning it was not yet revisited with trade in the RTH session.
So first we establish its importance as a bearish gate, and second we want to see how price reacts around the level on a (RTH) revisit.
As a final confirmation on Monday morning, ETH sellers were once again active at this level.
Image 3. ES partial TPOs, April 14

We opened above this pivot, and normally I would want to see the pivot bid to identify buyer strength. Instead we saw volatile two-way trade around this level - not enough context for me to jump in long, or short!
However sellers made a decision to take over in the D period, which took out the IB low. Once again, I failed to get a clean entry against a clear level.
The later retest of the pivot in the closing hour offered a potential opportunity however, as we were ramping price into the close on short covering. But was there any fresh, longer-term buying to be seen? The retest of the pivot from below would confirm that, possibly giving us a trade into the close!
Normally, I do not take trades in the last hour of the session, but a pivot is a pivot and typically worth a shot.
In the series below, I will identify key moments of price action using time stamps, with a brief description of the dynamics at each turn - as well as tips on how to trade them. I took entries in these locations on both days - one using puts and the other futures contracts.
April 14, Trading the Pivot
Video 1. ES 5m footprint and tape, April 14
I play the tape at 2x speed for the sake of your attention span, but I encouraged you to play back at actual speed to get a real feel for price action.
15h06:10. Buyer initiation is taking place following a ‘cup’ formation in price. Key now is to look for size for follow-through. Are the higher prices attracting more business?
15h07:25. This is now some further initiation, however note the volume per second. It has barely changed! Are sellers merely stepping aside?
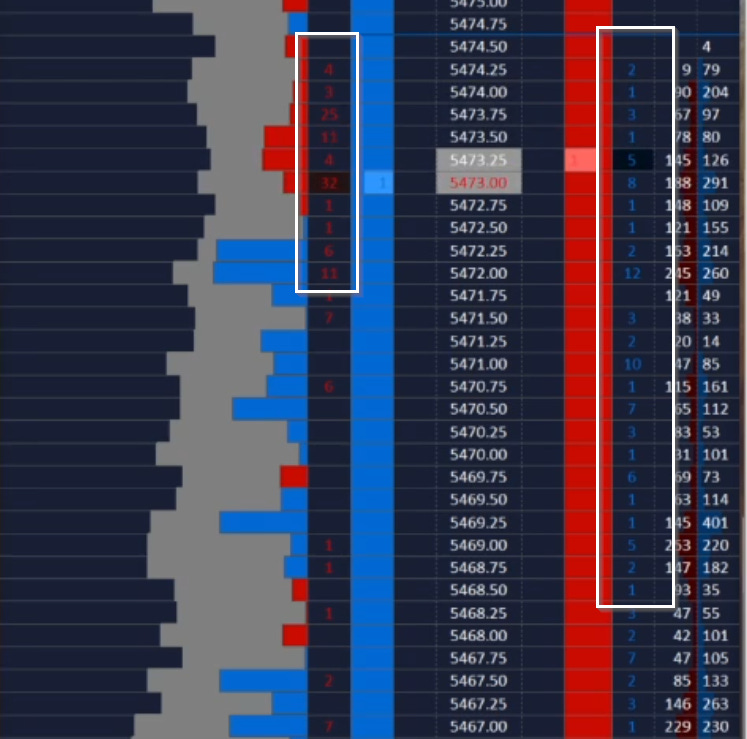
Now compare these two columns on recent bids and asks - note the small contract sizes from buyers (right side), as well as some opportunist sellers selling into the bid (left side). This isn’t indicative of buyer strength - more likely short-covering, or weak hands.
Image 4. DOM
I am still watching the pivot above.