Tape, DOM, Candle Course: Poor Lows and Highs, Lesson X
Dec 2-6, S&P500 (ES)
Each week I review key moments from recent price action in the indices. These instances will be analyzed using three methods: the tape / DOM; footprint; and candle chart. Synthesizing the three allows an understanding greater than the sum of its parts, leading to a total understanding of the auction process. While there are many great resources out there, I am not aware of any that provide such a comprehensive study guide.
If you don’t have or use all of these tools, that’s OK. They represent the same concepts in different forms.
There are no substitutes or shortcuts for hard work and discipline, but the material I share here is the closest head start you will find in your journey to successful trading.
If you enjoy my chart layout, join the Crowstack founders list and send a request. I will send you my set. In addition, you will receive access to my setups, high probability swing picks on your favorite tickers, and regular macro notes.
Week of December 2 Context
The week post-Thanksgiving.
This was one of the lowest volume non-holiday weeks on record. This notably left poor/weak lows and poor highs to an extent that I don’t recall seeing in some time, if ever.
This was after a weak push the prior Friday which in any case led to price establishing over the 6050 area, giving buyers some buffer above 6000 and a shot at new territory around 6109-6115, which was the main zone for me this week for continued upside.
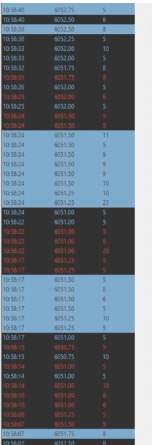
Image 1. ES daily TPOs
These poor highs and low will be the focus of this week’s lesson. I generally stay away from my trading desk on low range and volume. But let’s be honest, we all get the itch to place a trade if we’re at the screen for too long.
And this week gave us [many] opportunities to dissect the mechanics of poor highs and lows, otherwise known as a ‘lack of excess’. This simply means an incomplete auction - the formation of a crowded trade.
I. Analysis of a Poor Low: Tape/DOM/Candles/Footprint, Dec 2
The following videos in this lesson are all on 4x speed to demonstrate concepts. I recommend replaying at 1x in your spare time to fully appreciate price action.
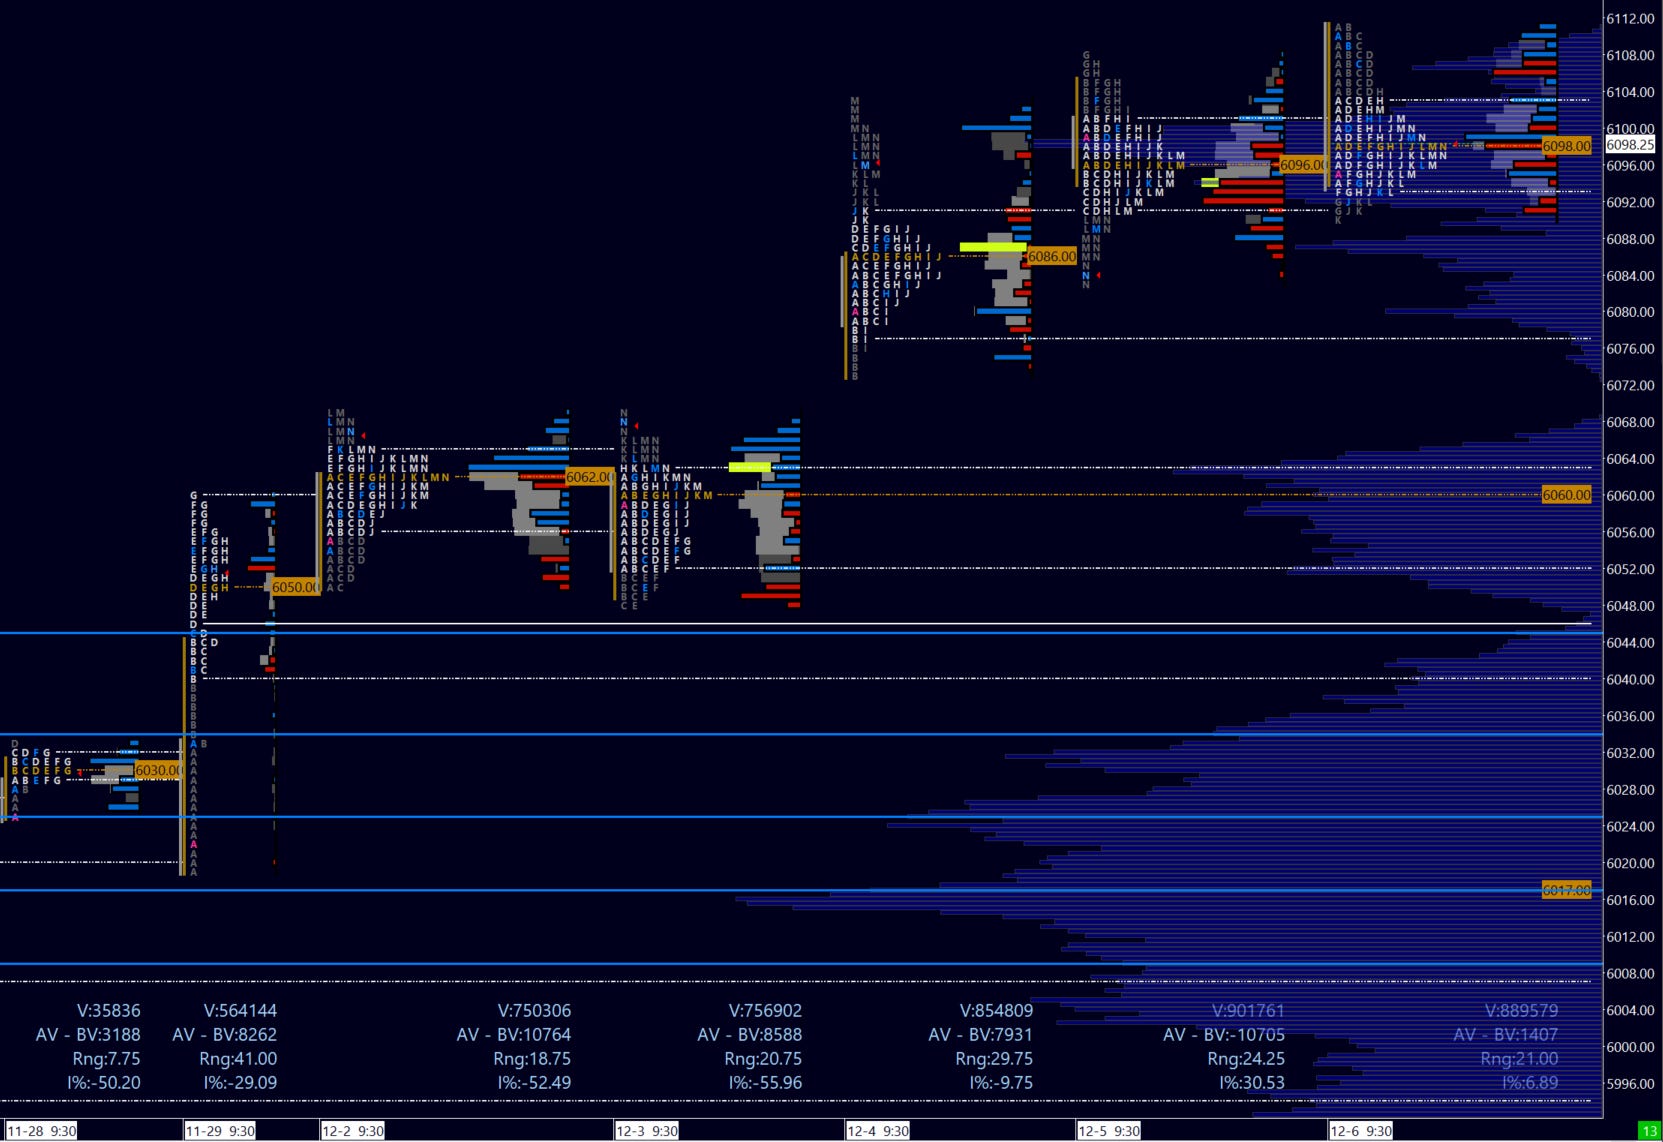
Image 2. Cheat sheet for Reverend Bird’s DOM
As I mentioned above, I avoid trading in a dull market. Less range means potentially the same stop for less reward, skewing your risk profile. As mentioned above, poor lows and high are crowded trades - these can be identified in the moment; however I still prefer to see counter-initiation out of them first, later leaning against a level of interest or an anchored VWAP.
Refer back to Image 1 to identify the poor lows and highs on the TPO.
Video 1. ES tape / DOM / footprint; 5m candles; 10h57 - 9:35EST 4x speed
Before you continue, always ‘look left’. Note the prior low at 9h55 retested in 10h55. Heavy red delta into the lows suggests a passive bid. Sellers look for continuation below the 6050 psych level.
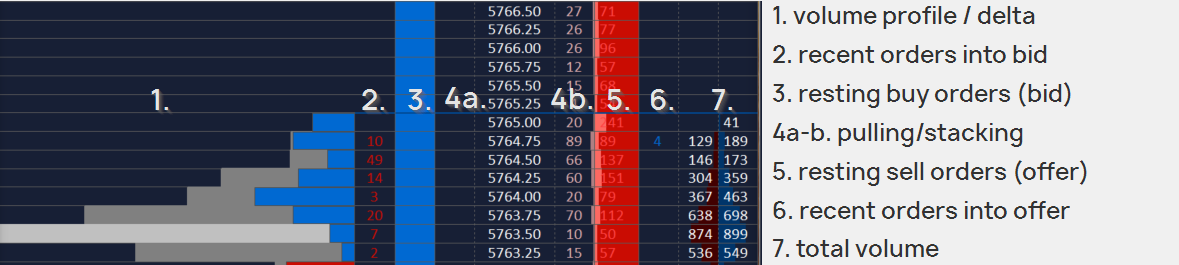
10h58:25. Observe the successive and quick hits into the offer, as highlighted on the tape. This alerts you to the presence of buyers. Remember, the period turnover is a minute away and it is more often than not better to wait to see the reaction at the half hour / hour mark.
Image 3. Tape