
September 11, S&P500 Plan and Missal
Garbage In Garbage Out
Image 1. Oscar the Grouch. J. Henson, Sesame Street (1969)

Those who know, know.
I titled yesterday’s Missal “Higher Plans” to maintain the thesis of balance with bias to the upside ahead of CPI. The data was just released and core m/m came in above expectations. But not above mine as I have insisted in this blog that we were not headed into a deflationary cycle of any sort at this time.
I could still be wrong but these prints don’t lend to the 50bp argument very well. I have stuck to the argument for a 25bp Q3 cut since last year. We’ll find out next week!
Manage your risk well today as most are expecting higher volatility. Only a few tweaks in the plan as we remain in balance.
Crow’s Nest
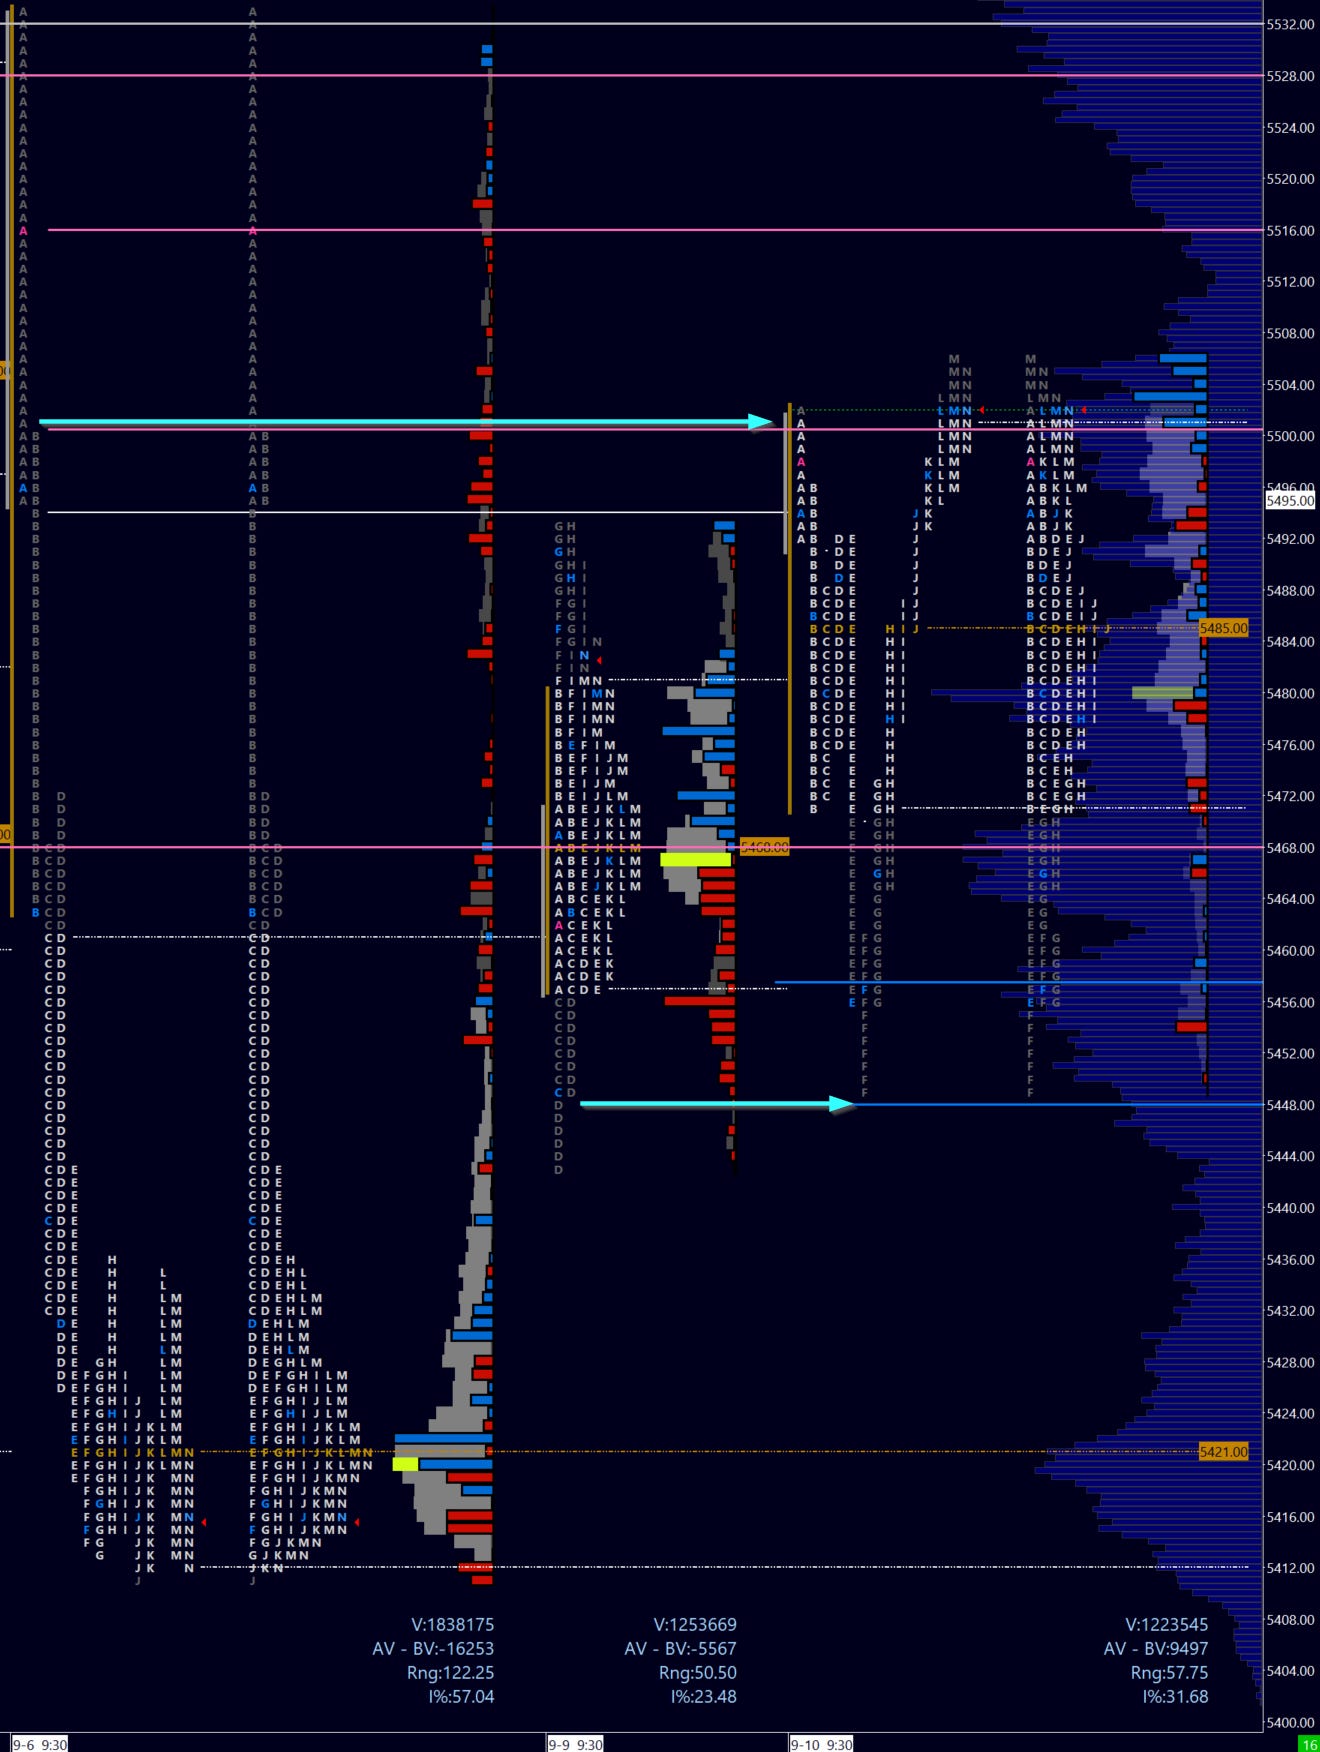
A higher low as Monday’s buying tail was maintained. We opened on a gap and buyers quickly thrust into Friday’s massive selling tail, only to find resistance at first. That was broken later in the day. I emphasize the importance of structural levels in trading as these are clear references that are approachable and effective for traders at all experience levels. See the image below to observe the reactions against the selling and buying tails.
These structural references are especially powerful with confluence of areas of liquidity or even fibs.
Image 2. Friday RTH to Tuesday RTH.
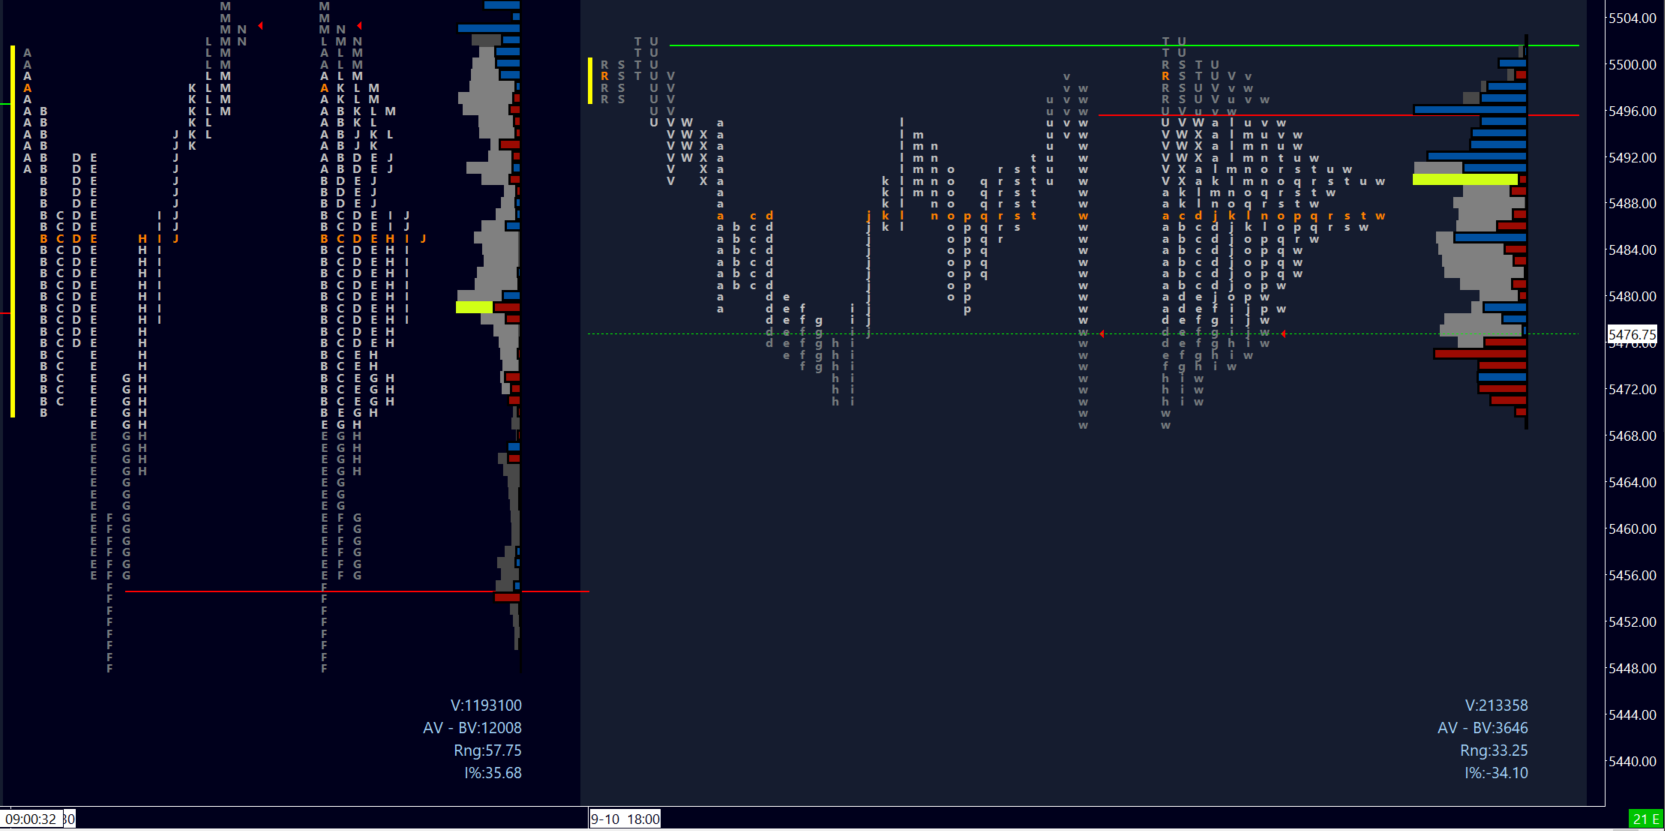
Overnight trade is balanced, trading almost entirely within Tuesday’s value area.
Image 3. ES Tuesday RTH to Wednesday ETH as of 8h40EST
I wasn’t terribly satisfied with Tuesday’s pivot early in the session (the selling tail was enough of a clue for the initial resistance), but it shone during the intraday poor high in D and E periods (Image 2). This is yet another kind of confluence that offer great trade locations - in this case the crowded trade (thus the poor high) at a key ‘inflection’ point we identified in advance. I wrote on my feed that poor highs often get revisited, and this was the case a few hours later as we broke into a NHOD by close.
Regardless I will stick to this pivot 5493 for today. Once we close above, a secondary pivot may be 5503 which - in addition to representing the M period break to the upside on Tuesday - was also an area of heavy liquidity as observed in the delta bars in Image 2.
Buyers look to make progress into Friday’s selling tail with the ultimate goal to close over Friday’s high. While OTFD has broken with yesterday’s gap open higher, sellers want to regain control with a close below prior day value area and a break of the PDL.
Wednesday Plan and Levels
Pivot 5493. Model was on point yesterday, it currently indicates 53 points range and 15 points potential overshoot. Be aware of intraday VIX spikes as we have seen how these affect range estimates.
a) Defense PDVAL 5470, or 5479 early on, looks to close over pivot on volume. This targets Friday open 5516, followed by 5528-5532 daily high where longer-term sellers may enter.
Time spent above the weekly pivot 5470 can maintain a bullish lean. A combination with volume can be lethal for trapped sellers. Note 5539 50DMA above which is the buyers’ near-term target. Just above is 5546 LVN.
b) Time below pivot and volume below 5479 target PDVAL 5470, 5446 100 DMA where longer-term buyers may be encountered. Momentum below looks for 5435, NPOC 5421 and 5411 at an extreme.
c) VIX pivot remains at 19.40. Consider seller strength above 20.50, and buyers potentially supported below 18.90.
Image 3. ES 4H levels
This material is designed to improve your trading and remains free. You can support my work by liking, commenting, sharing my work with your bird friends or on Twitter - and certainly with a contribution. I appreciate your support: it keeps my work consistent and timely!
Tip jar

Be sure to follow me @rareverend on X (Twitter) for the latest updates.
Don’t maintain bias in the face of contradicting information! Capital preservation is key.
This is CERTAINLY not investment advice and I am not a qualified licensed investment advisor nor a minister of the church. All information found here, including any opinions, commentaries, jokes, outright mistakes, and suggestions - expressed or implied herein - are for informational, entertainment or educational purposes only and should not be construed as personal investment advice. While the information provided is believed to be as accurate a picture of trade as I see it, it is after all how I see it and errors or inaccuracies are practically expected. I will not and cannot be held liable for any actions you take as a result of anything you read here. As always, conduct your own due diligence, or consult a licensed financial advisor or broker before making any and all investment decisions. Any investments, trades, speculations, or decisions made on the basis of any information found on this site, expressed or implied herein, are committed at your own risk, financial or otherwise.