
Sept 27, 2023 Missal: Gap Trap
4300 is the new 4350.
Image 1. If you have to ask, probably not. (Shanahan, The New Yorker Magazine)

In yesterday’s closing notes I mentioned that short-term (5D) value fell below 4k to 4371, itself a victory for sellers. Not only this, I also cautioned (with a zombie reference) the composition of buyers at the PDC - as well as ‘follow through blues’ in a less than encouraging rally for the buyers. So here we are closing below August lows and flirting with another contract gap and 4300 psych level. Despite this, buying interest was clearly present on tape on the way down, the question now if sellers have shown exhaustion. I am not convinced just yet, although we could be close.
Day Review
Overnight left the buyers at PDC hanging as globex open marked the high. By Europe open nearly the entire previous day’s range traded through to the downside. Buyers did manage to bid up into the 4367 area of prior sellside liquidity before more sellers jumped onboard, leading to an open near the ONL. Chances for a counter auction at open are historically 70% - shorts indeed covered positions while early buyers hit the tape. However longs ran into trouble at ON support 4354.
Once through open, sellers initiated through the ONL and PDL on heavy volume. As we mentioned in our plan, volume would likely result in continuation in the direction of the break. The IB established some support at 4325 but OTFD continued despite a counter auction in F through H periods. We marked the 4335 level in our charts intraday as this 10 point zone supported strong two-way trade until a break in I period. This continued OTFD into the rollover gap, stopping within three ticks of the June settlement price.
The daily profile was an effective tripe distribution, with emotional selling into the 4335 level. Despite two way trade around 4330 and the location of the day’s TPOC, sellers managed to break 4325 into further price discovery. Interestingly the day was well bid, closing on nearly 14k positive delta. Sellers did leave a poor low and a small gap from rollover, suggesting that buying is yet inconclusive until MGI confirms a bottom. With PCE Friday there is likely time to evaluate before going for a potential swing long and EOM rally. This would translate to either a) sellers exhaust b) market establishes balance c) combination of both and a close above a critical level. I have not seen any of the criteria yet as we continue OTFD. Sure, a starter position is fine, but isn’t a little late better than a whole lot early?
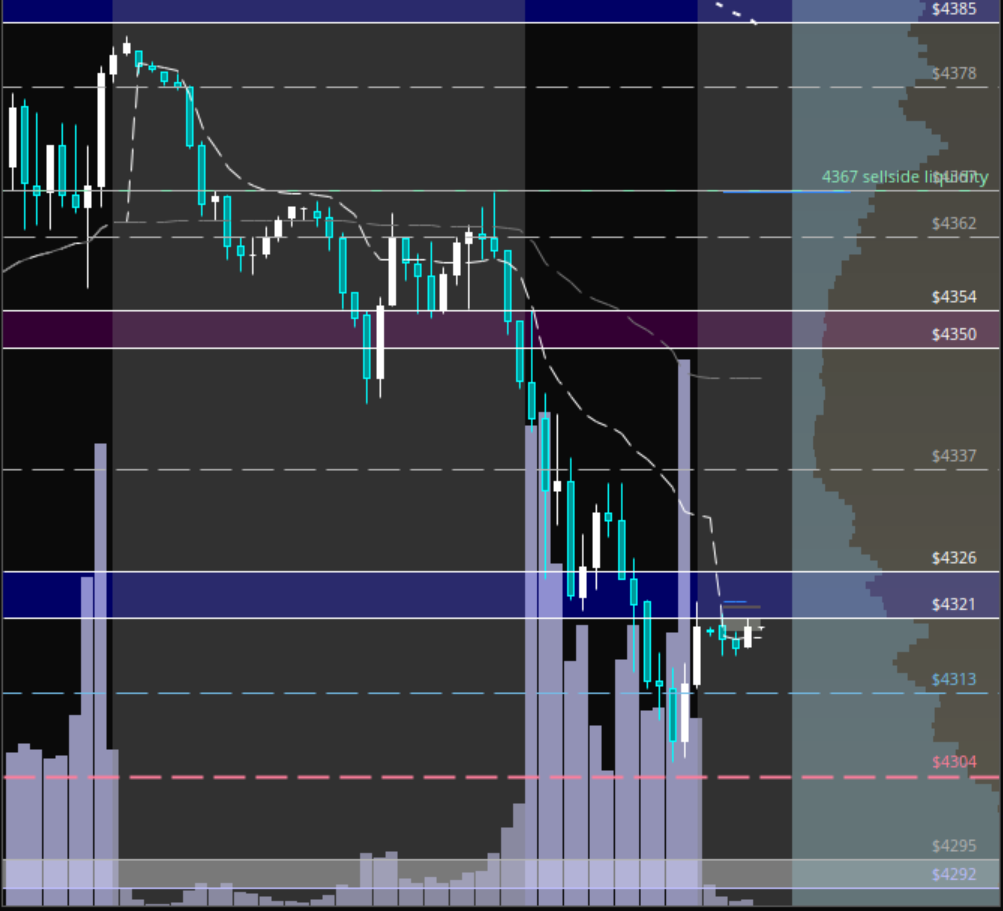
Image 2. Tuesday ETH and RTH 30m chart
Wednesday Missal
Buyers look to reject Tuesday’s afternoon downside initiation with a reclaim of 4325 in RTH - the intraday auction support and Wednesday’s pivot. Sellers aim to break the 4300 psych level to explore targets below.
All eyes on VIX now as it approached 20. It may very well attempt a test having come this far - which would likely correspond to trade under 4300 and possibly into 4280. Buyers want to see VIX return under 17.8. TSLA has been holding up remarkably well, while further tests of 240 are possible this is the level to hold for buyers. Momentum over 252 could support the indices. Indices may be further supported with AAPL reclaiming 175.50.
Buyer scenario. Buyers above pivot will target a break of 4337, targeting 4351 where sellers are likely to step back in. A break of 4351 on volume targets 4367, 4378 with 4390 further above.
Seller scenario. Maintaining pressure below 4325 targets contract gap fill 4302. Break of 4300 could see 4290 (balance POC 4288), which may see buying activity. Further on is 4283 and 4274 buyside liquidity. In an extreme liquidation case, 4250 (levels 4256 to 4243) is the next major psych support.
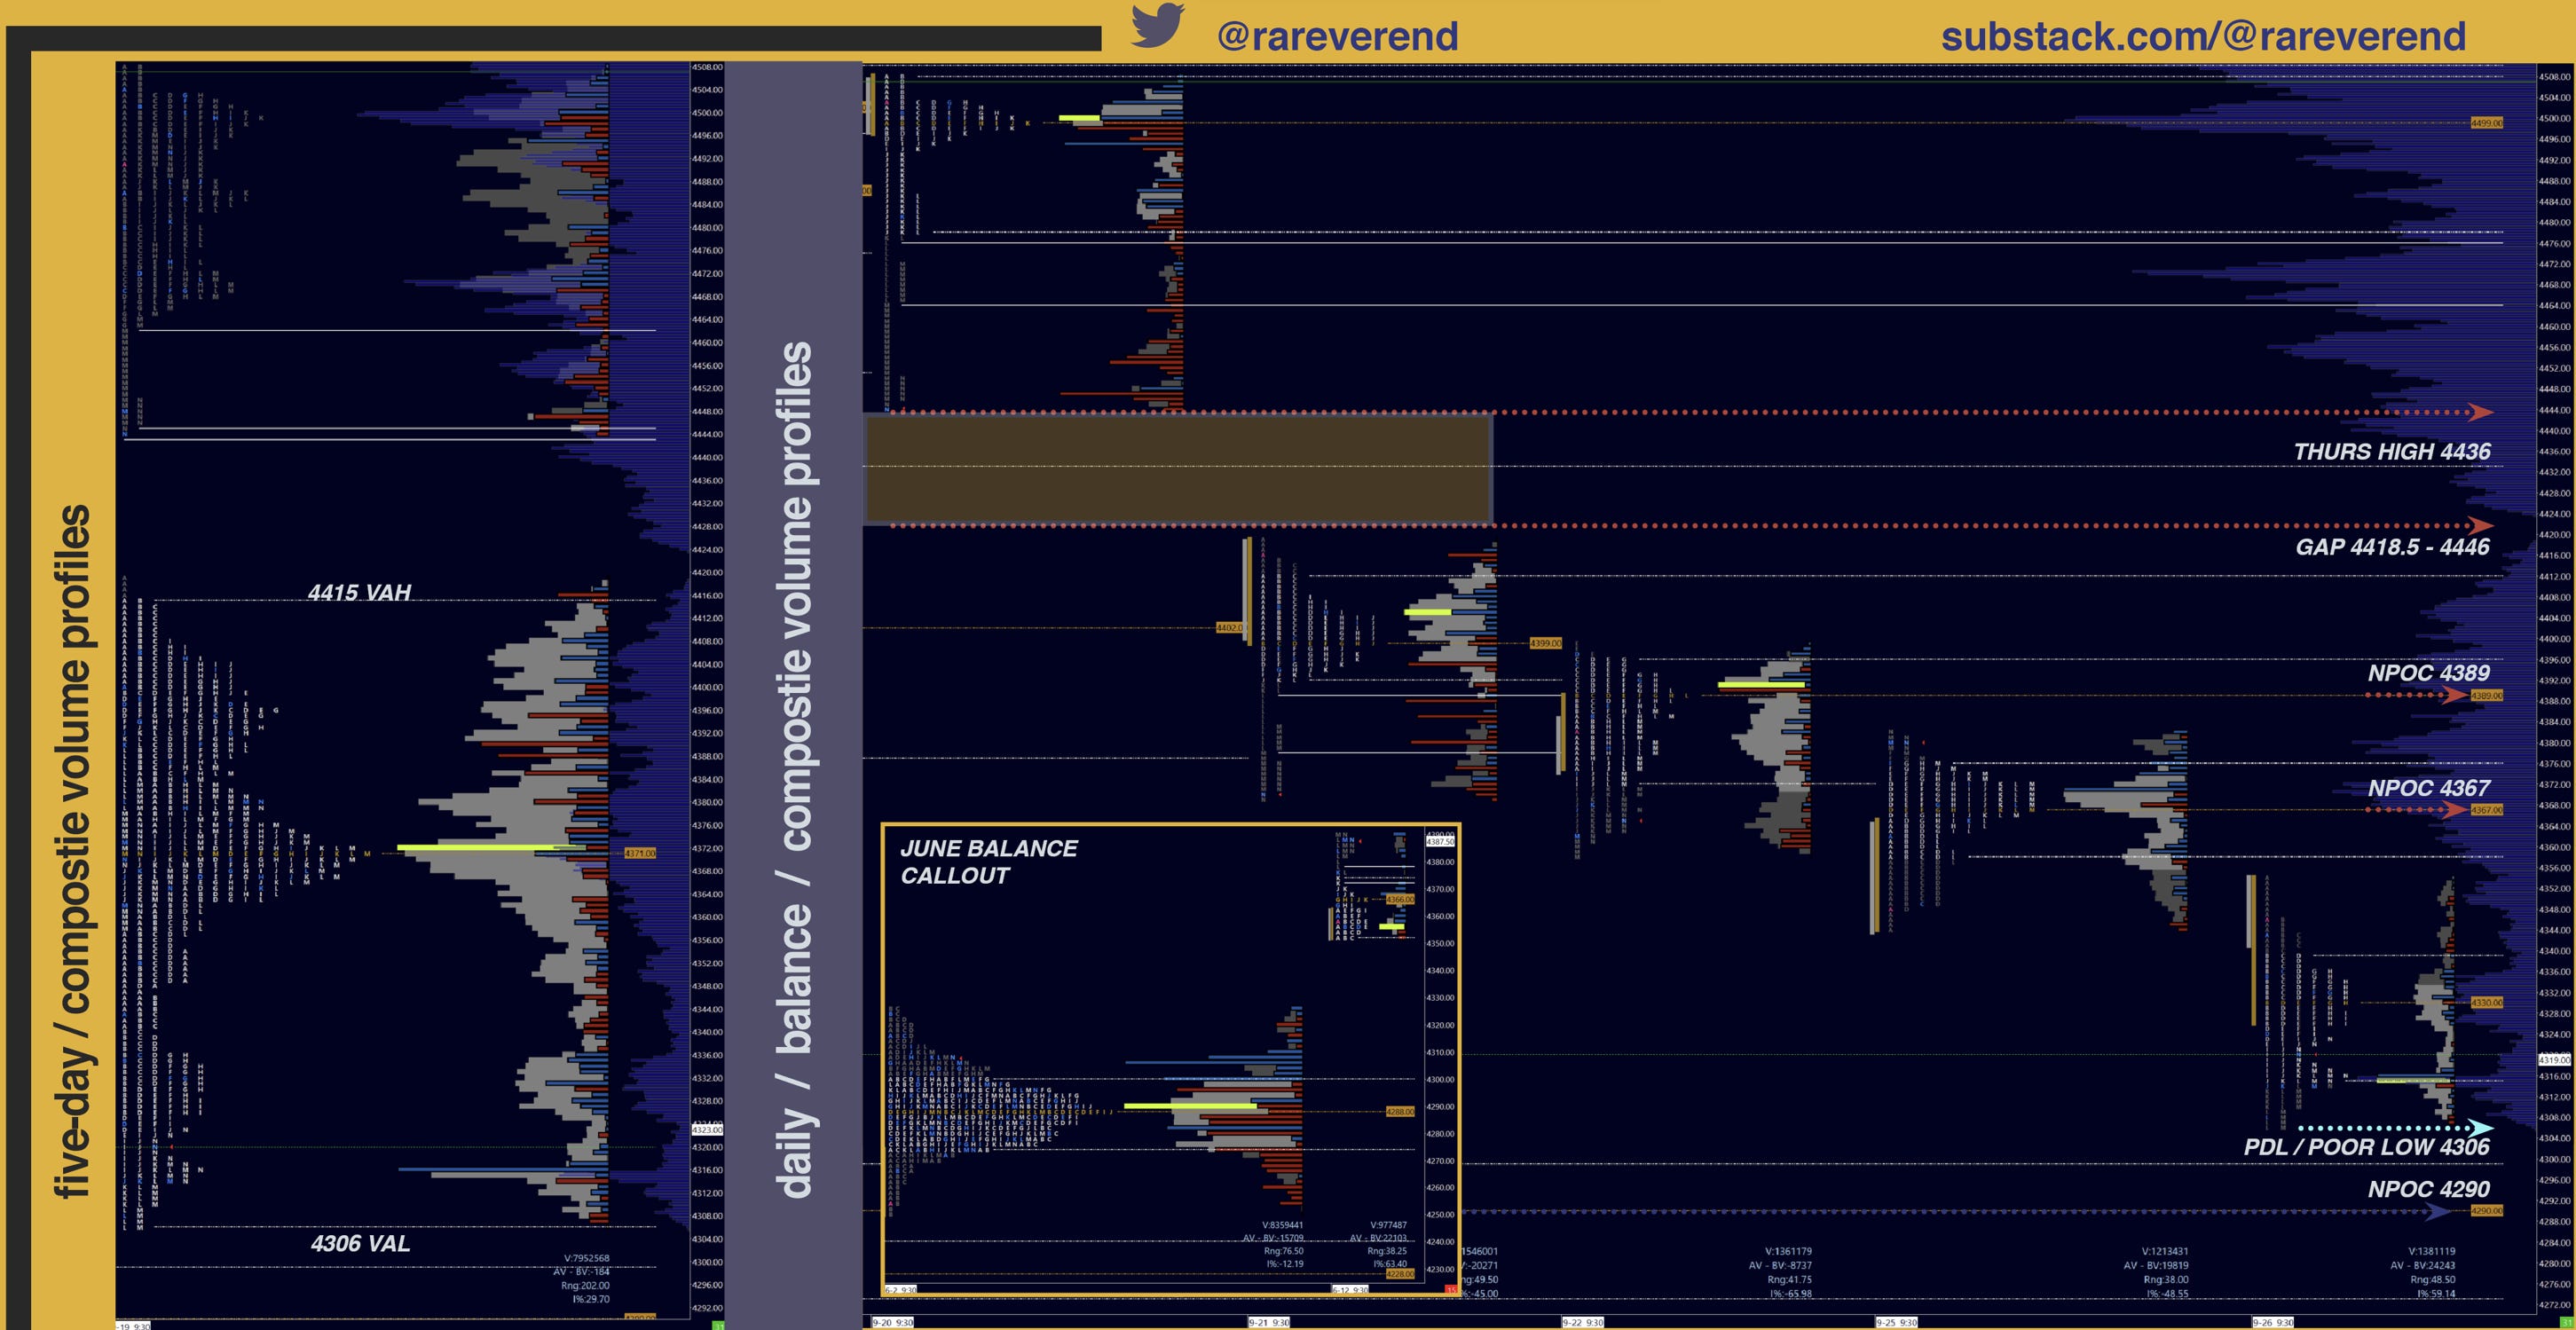
Image 3. Local landscape
Tip Jar - your support helps to keep my work going!
Don’t maintain bias in the face of contradicting information! Capital preservation is key.
This is not investment advice and I am not a qualified licensed investment advisor. All information found here, including any opinions, commentaries, and suggestions, expressed or implied herein, are for informational, entertainment or educational purposes only and should not be construed as personal investment advice. While the information provided is believed to be accurate, it may include errors or inaccuracies. I will not and cannot be held liable for any actions you take as a result of anything you read here. As always, conduct your own due diligence, or consult a licensed financial advisor or broker before making any and all investment decisions. Any investments, trades, speculations, or decisions made on the basis of any information found on this site, expressed or implied herein, are committed at your own risk, financial or otherwise.