
Profile Primer I
April 28 - May 2, S&P500 (ES)
A subscriber asked for some guidance on using the market profile this week. This is at the core of my daily planning and identifying levels - in this lesson we will review key area and their significance for the following price action.
Image 1. Peter Steidlmayer. The ‘[bird] who knows where the market is going’

The Market Profile
For those of you not familiar with the market profile, I highly recommend the gold standard study guide from CBOT. Yep, you can find it for free at that link, no sign-up necessary.
I will assume many of you have at least some familiarity with the market profile. But for those new to the tool, understand that for each price (or handle) traded in a time period, for example 9h30 to 9h59 - one letter will print, representing that period. So if we assign an ‘A’ to this period, and price trades as low as 5504 and as high as 5519, then fifteen ‘A’s will print across those prices. Or 60, if you were going tick by tick!
The next period from 10h00 to 10h29 (we are using half-hour periods) will print the next letter of the alphabet, ‘B’, for each handle traded in that period. And so on. You’ll get the hang of it!
Now, when all these letters are ‘piled together’ onto the y-axis, they will form a shape - usually pretty close to a normal distribution curve - with skinny tails and a fat middle. Variations in this shape reveal extremely important clues about the market and the relative positions of buyers and sellers. And certain traits - like a low-volume node (single prints, or just one letter across some prices during the day), or poor structure (multiple single sprints in different areas), or a poor high/low (two or more prints side by side with no singles above or below) can generate levels to trade against.
That is where study comes in. It’s an extremely powerful tool, and timeless - which is why it remains relevant from the 1980s, when it was developed, to today.
Image 2. ES market daily market profiles (April 28-30 expanded)
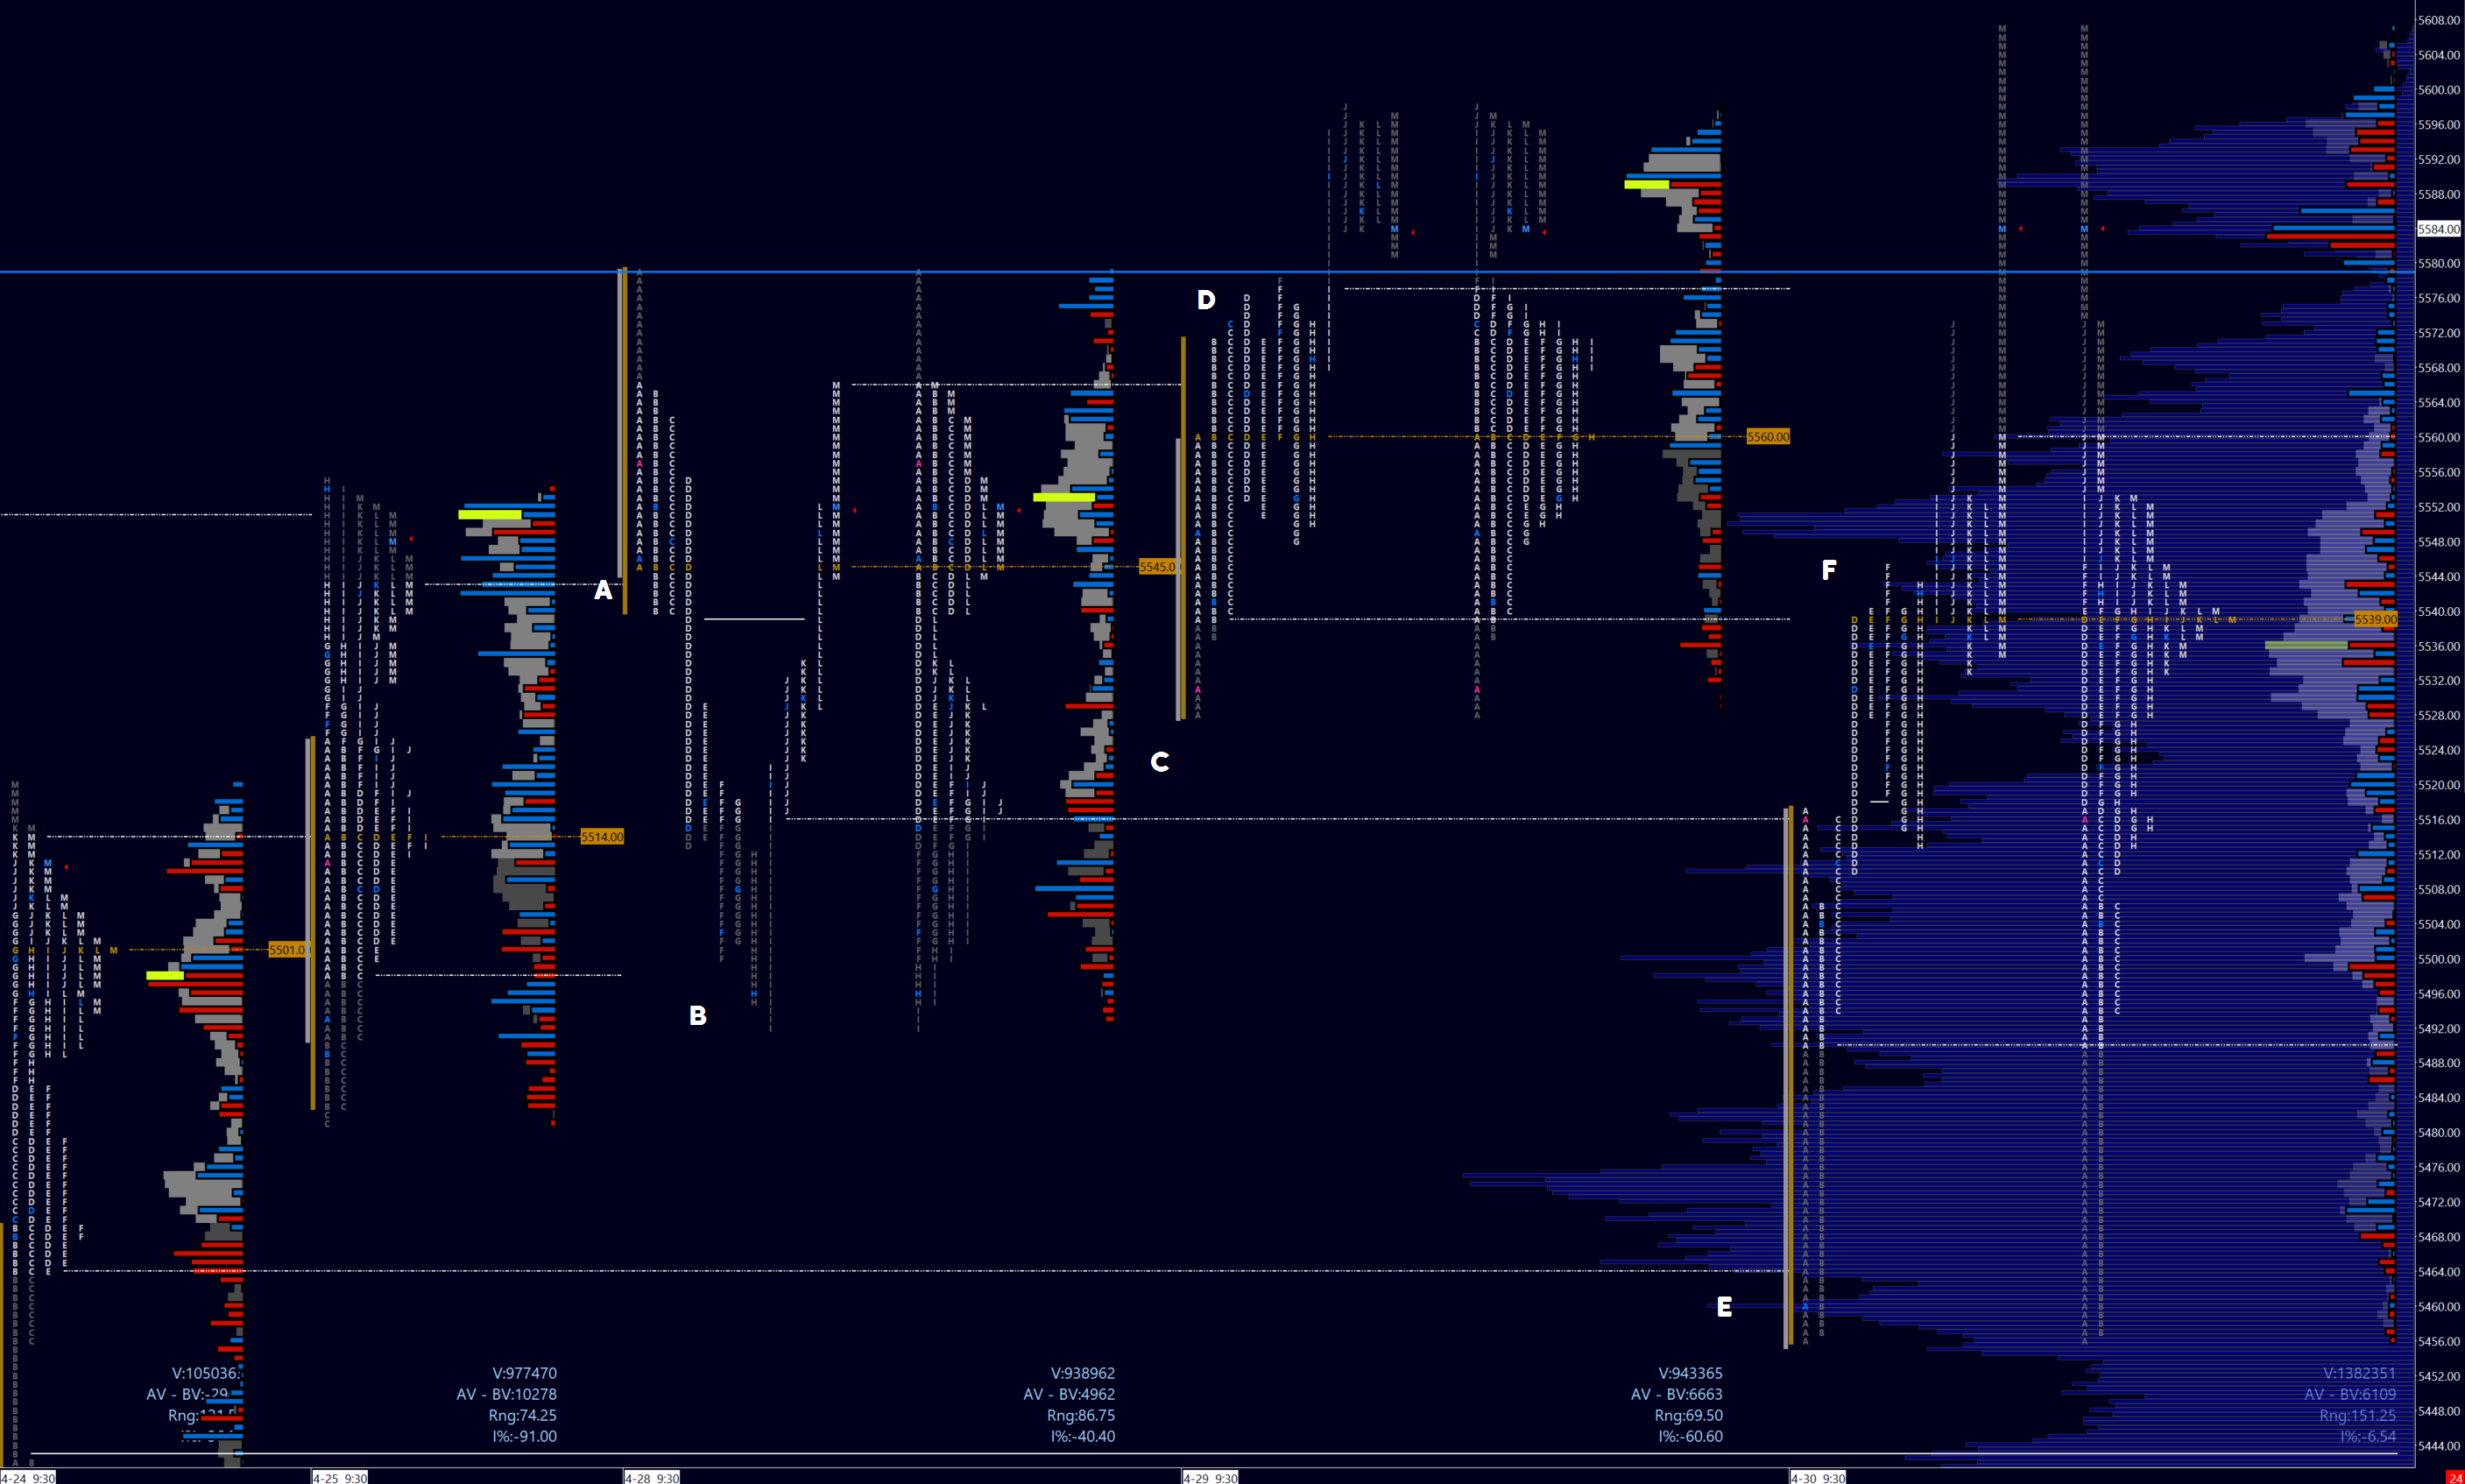
Click to expand the image, however I will be sharing more callouts below. The areas I have identified are important to understand - and trade against - based on information contained in prior profiles. Profiles aren’t just meant to be used intraday, but apply to all timeframes.
For those new to my charts, the white highlighted letters are the value area (or where two standard deviations of trade took place - call it 70%, or the bulk of birds) - with value area high (VAH) at +2SDs and value area low (VAL) at -2SDs. The orange letters I use to denote the point of control (POC), or the median price. A traditional market profile with deltas mirrors (on the right) each market profile.
Let’s go.
Image 3. Friday and Monday profiles. Monday is expanded
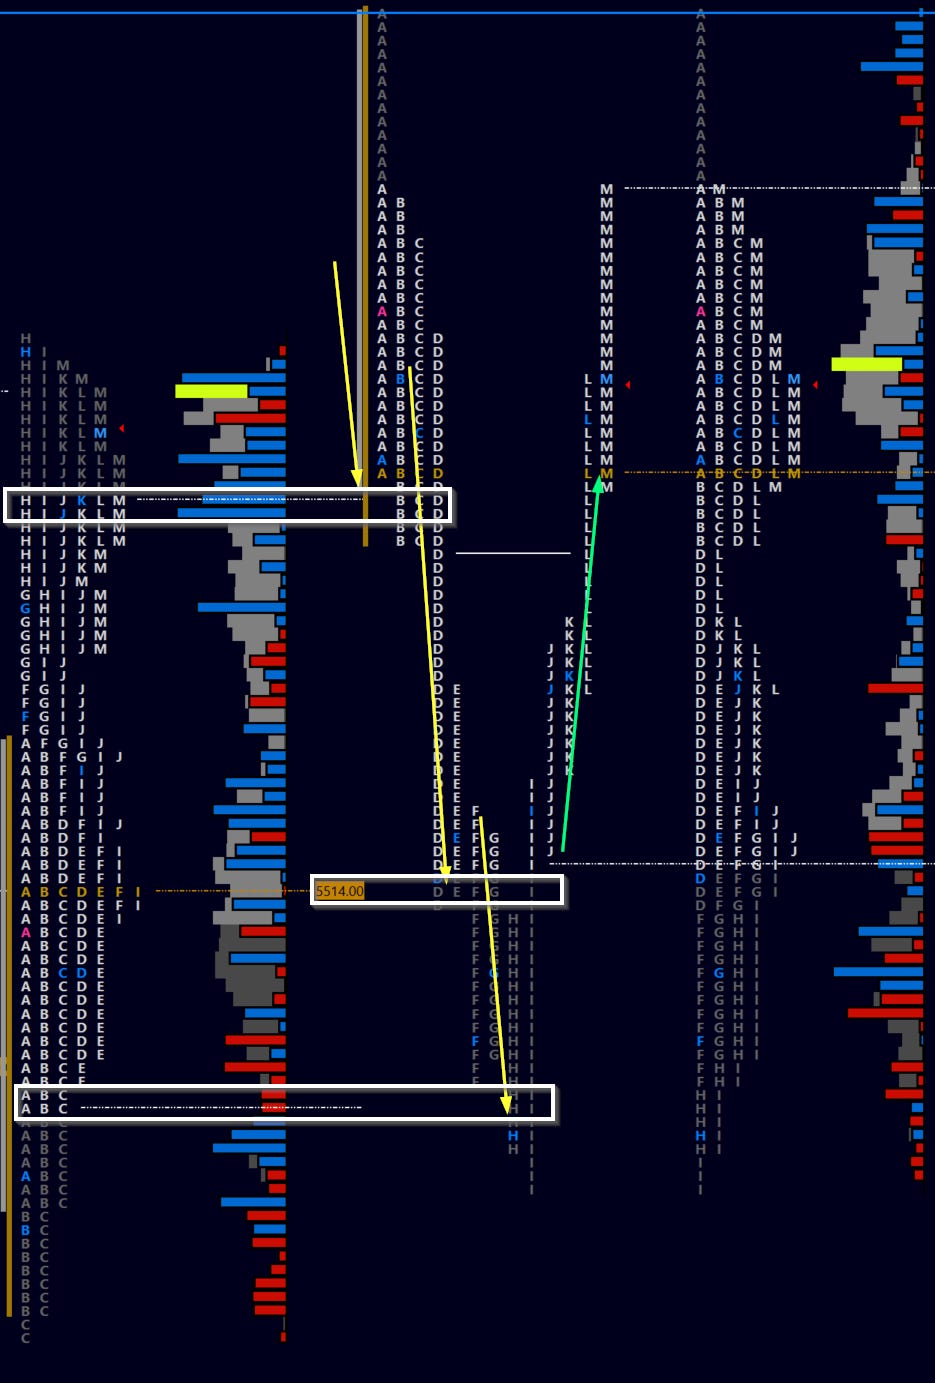
A. We start the week with a reference to the prior Friday’s profile. Note the early support at the prior day VAH, but with lower highs (A, B, C… and D! consecutively), buyers are losing steam. There is a good chance we fail and traverse the prior day value area.
B. And that’s exactly how we would have set up targets for any short trade taken in the first four periods - the first being the POC then VAL, then any runners left over for further weakness. Note the support at Friday’s VAL, with the I period cleaning out weak shorts.
Here’s an intraday tip for reversing to the long side. Note the J period low just above Friday’s POC! That would be a great area to lean on now that we have established sellers were weaker than initially though.
Image 4. ES profiles, Monday and Tuesday