
Profile Flash Cards: IB Retests
Not Too Early Bird

This week the world will be entering a period of chaos before the ‘new normal’ - which may take years to reformulate. This will affect core markets - oil, metals, equities, and most importantly, currencies.
The latter may be the most difficult and painful to navigate. Geopolitical stakes are presently too high, with consequences for the previous social contract, which no longer can serve its purpose. It’s a bit much to get into now, I just want to keep this lesson open to all!
Image 1. Blood moon

That’s to say that even in a period of extreme turmoil, human patterns exist. These characteristics in the system can be exploited in trading.
The profile will be a powerful tool to distill sense and order in chaos.
Leveraging the Market Profile
As always, recall the study guide from CBOT. No sign-up necessary.
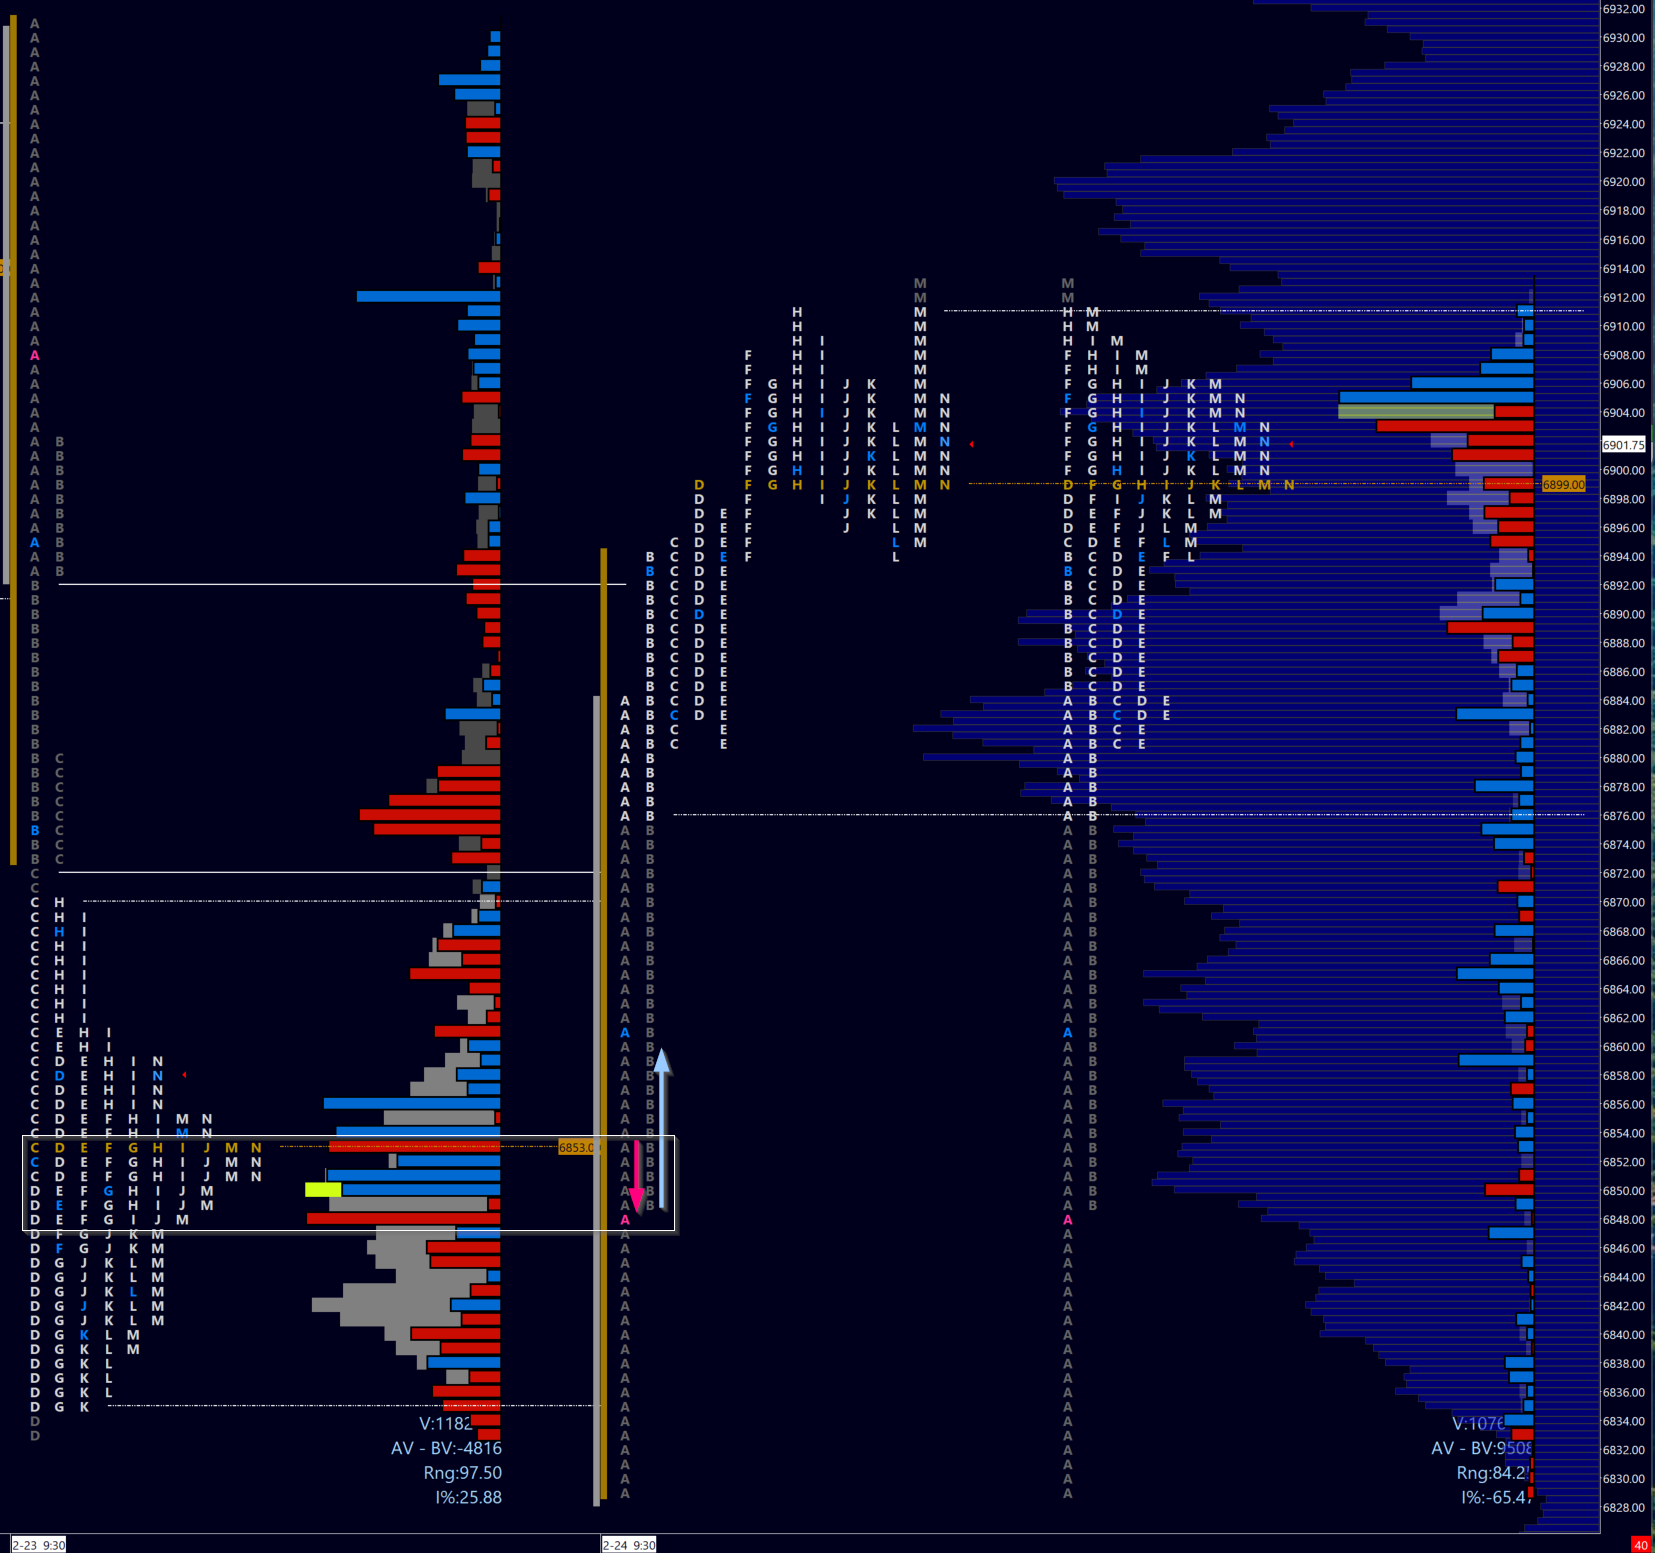
Image 2. ES profiles, Tuesday Feb 24 in review
We’ve all been in situations where something holding us back from acting rationally later turns and forces us to act irrationally. Typically to our detriment.
This lesson highlights two examples last week during the initial balance (IB) that led to solid trading opportunities. Using nothing but the market profile.
Tuesday, February 24
The A period (first 30 minutes) was arguably chaotic, with trade traversing all of the prior day value area and then some.
Image 3. ES 5m chart
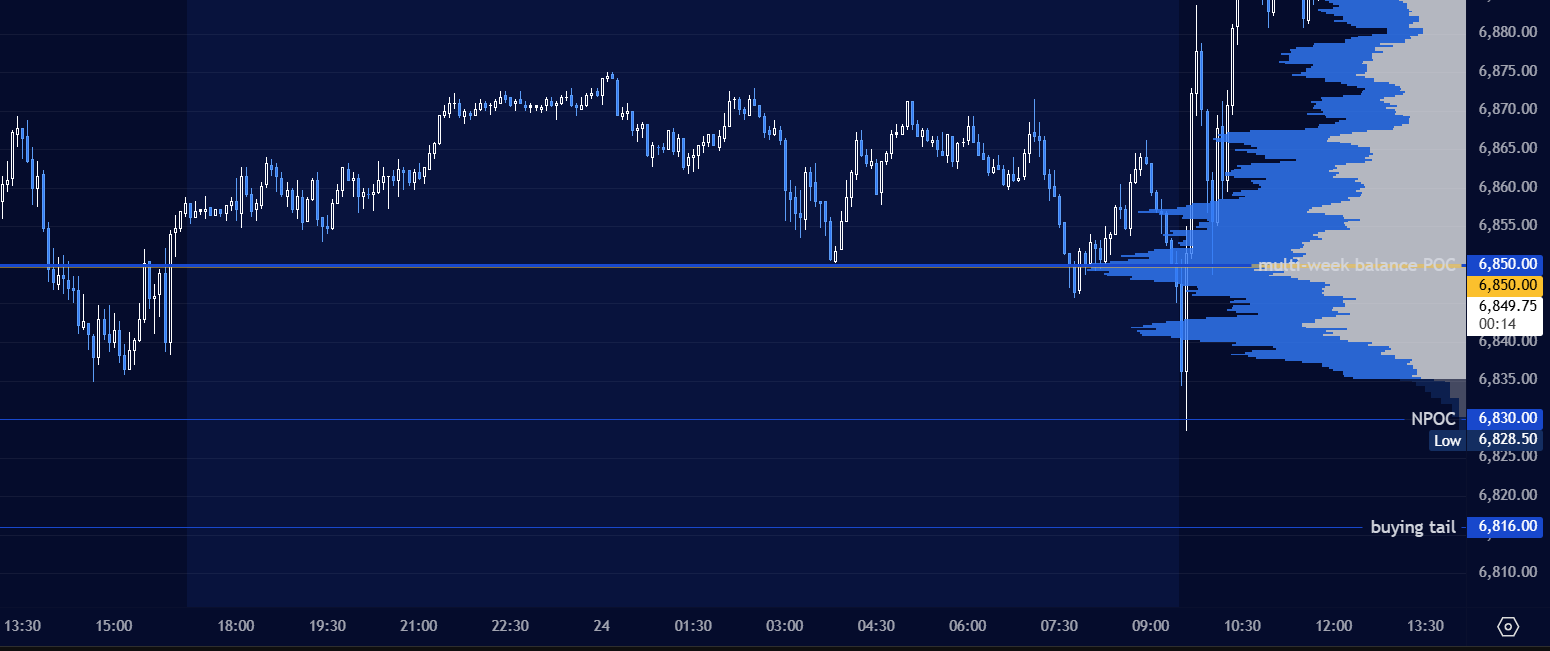
We saw a classic ‘look below and fail’ of the prior day low, and many traders clearly noticed this after the fact, piling into longs once past the opening level, only to see blood ahead of the B period open (10h00EST on my charts).
This is precisely why I prefer to wait for new periods to start!
That 10h00 five-minute period was the retest low, and a near-perfect entry point for the real long that day once the weak hands were shaken out. Refer back to Image 2 - confluence of both the day’s open and the prior day POC.
A bonus tip - Monday’s ‘b’ shape profile indicated seller absorption. A strong long setup would be support at its POC in the following session(s) which suggests trapped shorts would be looking for a place to exit positions.
Thursday, February 26
This was a really elegant opportunity.
Image 5. ES profiles, Tuesday Feb 26 in review
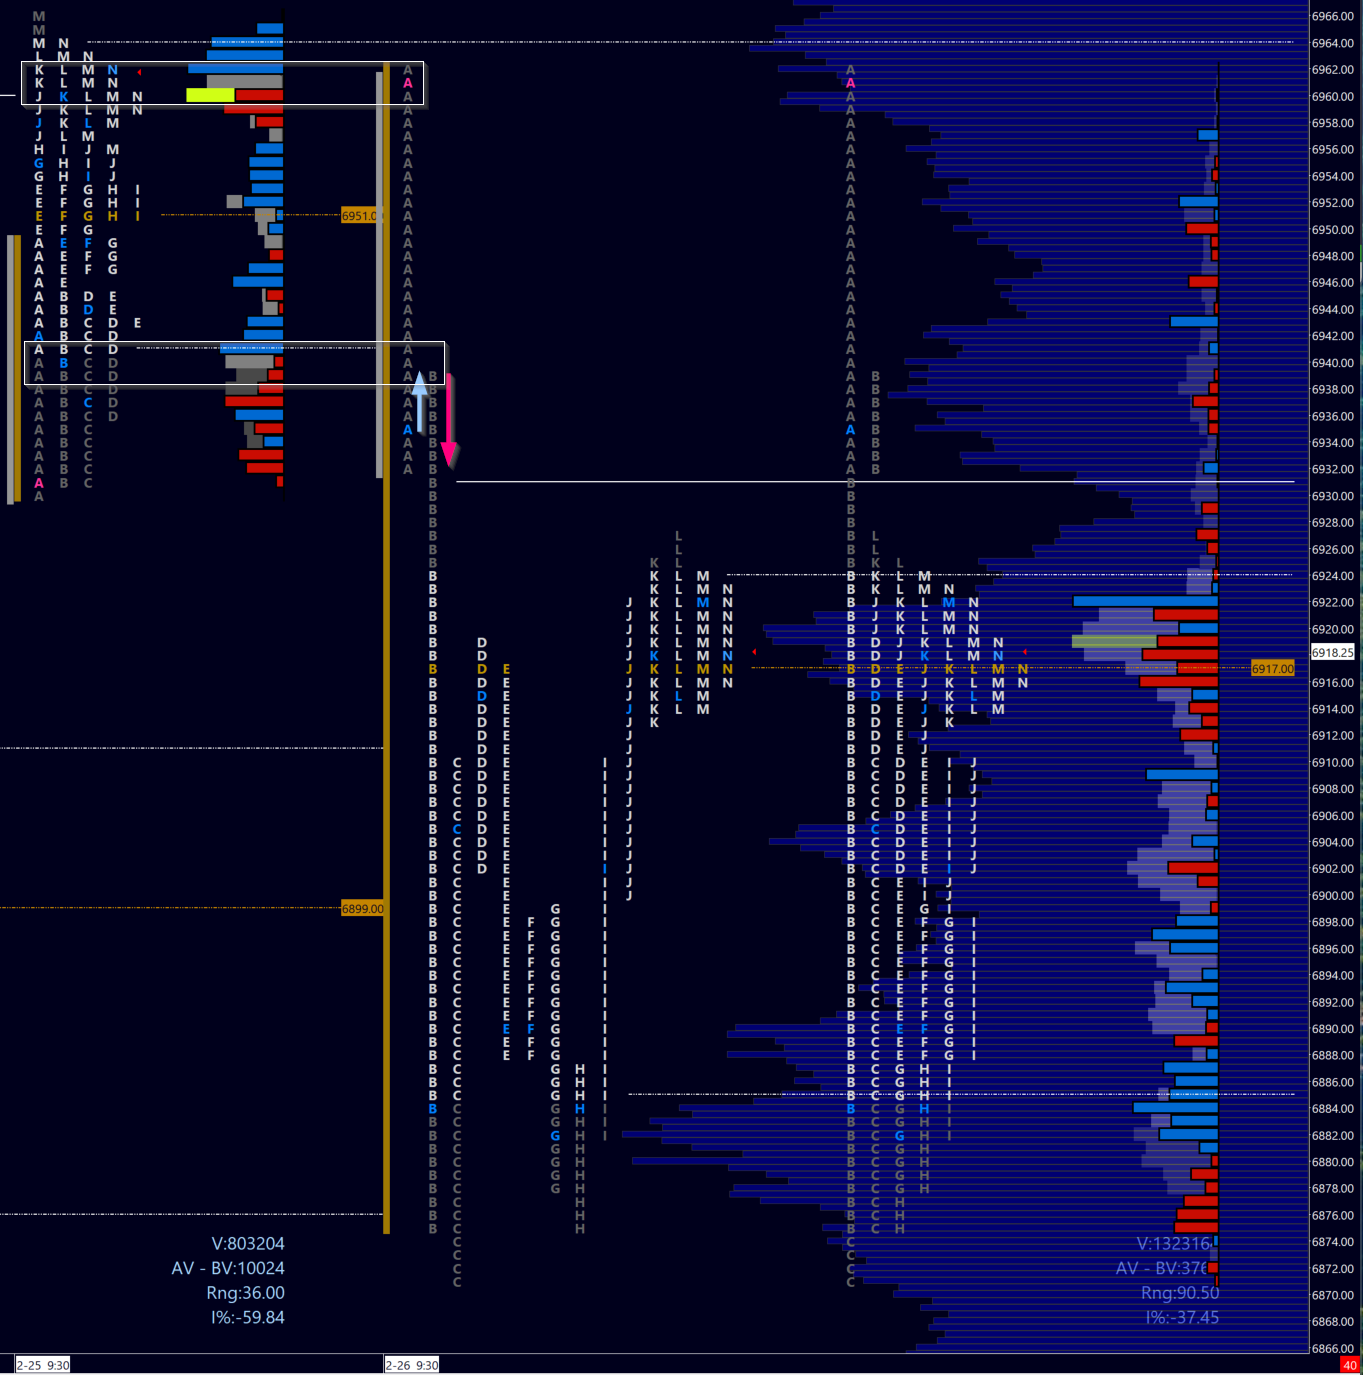
The day opened with an open-drive of the prior day’s close. An open-drive is one of the hardest trades to catch. They are less than 12% of trading days thus making them difficult to scale.
But this is where the profile comes in handy.
Let the A period shake out, it’s fine. Wait for the next period to open, and ‘look left’. That means we take note of the prior day’s value area low. With such strong seller momentum, shorts would want to keep pressure below the prior day’s value. Especially as we had a 17 point gap below!
Ideally, we look to lean against the VAL, with minimal risk (perhaps 4 points) for a gap fill and possible continuation. We fell just short of a VAL retest, an additional sign of weakness. That throws many traders off, expecting exacting levels. Here’s where our 5m chart comes in handy.
Image 6. ES 5m chart
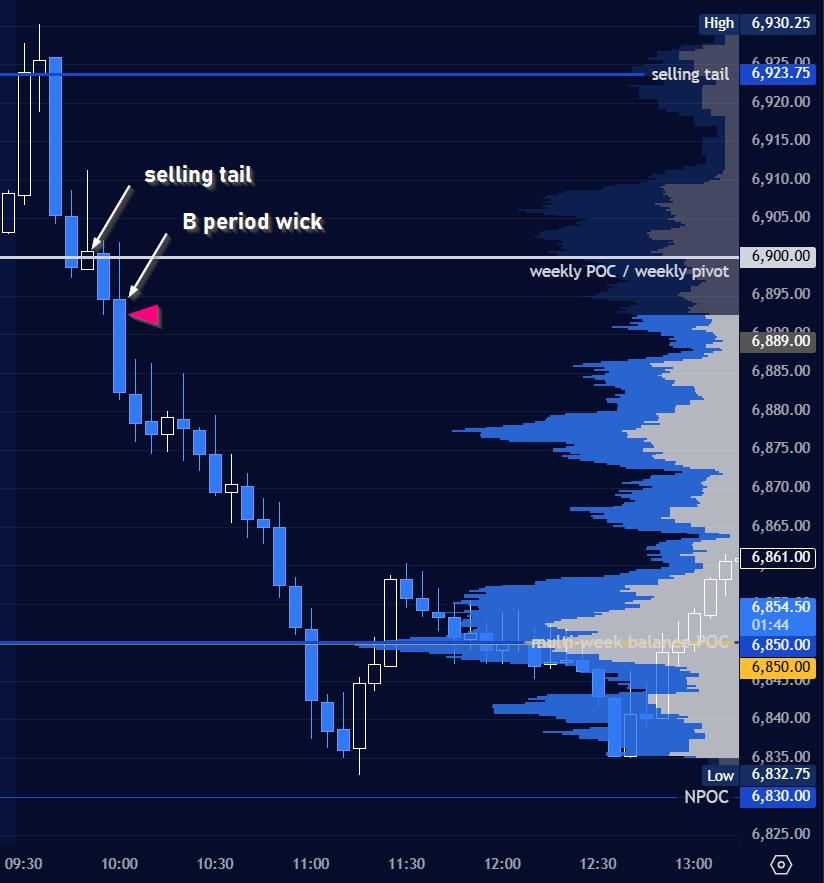
It gives us some further clues, namely the 5m selling tail on a “green” candle - white in my charts. Strong selling intent often sees the tail base defended. And certainly the mid-points.
With that said, the opening B period candle puts in another wick… at the selling tail base! I then typically short the break of the prior 5m candle, using 4-5 points of risk above.
**In both of these cases, we waited for the reaction of the B period before entering a trade, setting tight risk once we established weak hands were taken out of the game. It pays to wait, avoiding rising mental and financial capital in the midst of chaos.
I can’t stress enough how much the profile informs my trading. The Crowstack covers the big and small pictures - it’s the art of integrating the two into a cohesive narrative about the market at a given time. Zoom in but be mindful of context. This series will help you organize your thoughts and execution within this hierarchy.
Don’t sweat over all the details - this tick versus that one, 15 contracts per second versus 12. A shade of blue. Sometimes clues may conflict - if you can’t describe the current price action with a cohesive story, maybe it’s best to wait for a clear trade opportunity. There will be many more.
Stand back and let the narrative unfold. And don’t forget to breathe!
Simplicity leading to clarity leads to success. If you have any questions, leave them in the comments below.
Have I improved your trading? You can support my work by liking and commenting, and sharing my work with friends or on Twitter. I appreciate your support: it keeps my publication ongoing and timely!
Tip jar

Be sure to follow me @rareverend on X (Twitter) for the latest updates.
Don’t maintain bias in the face of contradicting information! Capital preservation is key.
This is CERTAINLY not investment advice and I am not a qualified licensed investment advisor nor a minister of the church. All information found here, including any opinions, commentaries, jokes, outright mistakes, and suggestions - expressed or implied herein - are for informational, entertainment or educational purposes only and should not be construed as personal investment advice. While the information provided is believed to be as accurate a picture of trade as I see it, it is after all how I see it and errors or inaccuracies are practically expected. I will not and cannot be held liable for any actions you take as a result of anything you read here. As always, conduct your own due diligence, or consult a licensed financial advisor or broker before making any and all investment decisions. Any investments, trades, speculations, or decisions made on the basis of any information found on this site, expressed or implied herein, are committed at your own risk, financial or otherwise.