
Price Action Analysis: May 2, S&P500
Identifying exhaustion and reversal
Image 1. Seneca studying the chart, favorite ticker SENEA
Thursday, May 2 was a big mover day - these are the sessions that can make your month, or even the year if sized and managed correctly. The most important thing is not to lose sleep over missed opportunities. There will be countless others - whether in BTC, CL, or your favorite stock like GME (but I’m not one to judge).
I go into detail in the following case studies.
Luck is a matter of preparation meeting opportunity
—Seneca
The Look of a Bid Part I
I typically mark up my charts (you can find many more examples on my Substack and Twitter) but I chose to leave these clean. The goal is to begin recognizing concepts on your own - after all charts don’t mark themselves up in real time. You should be able to follow along easily as I describe clues in the chart, or even see some that I overlooked. If so, share them in the comments below!
Image 2. ES footprint, May 2, click to enlarge
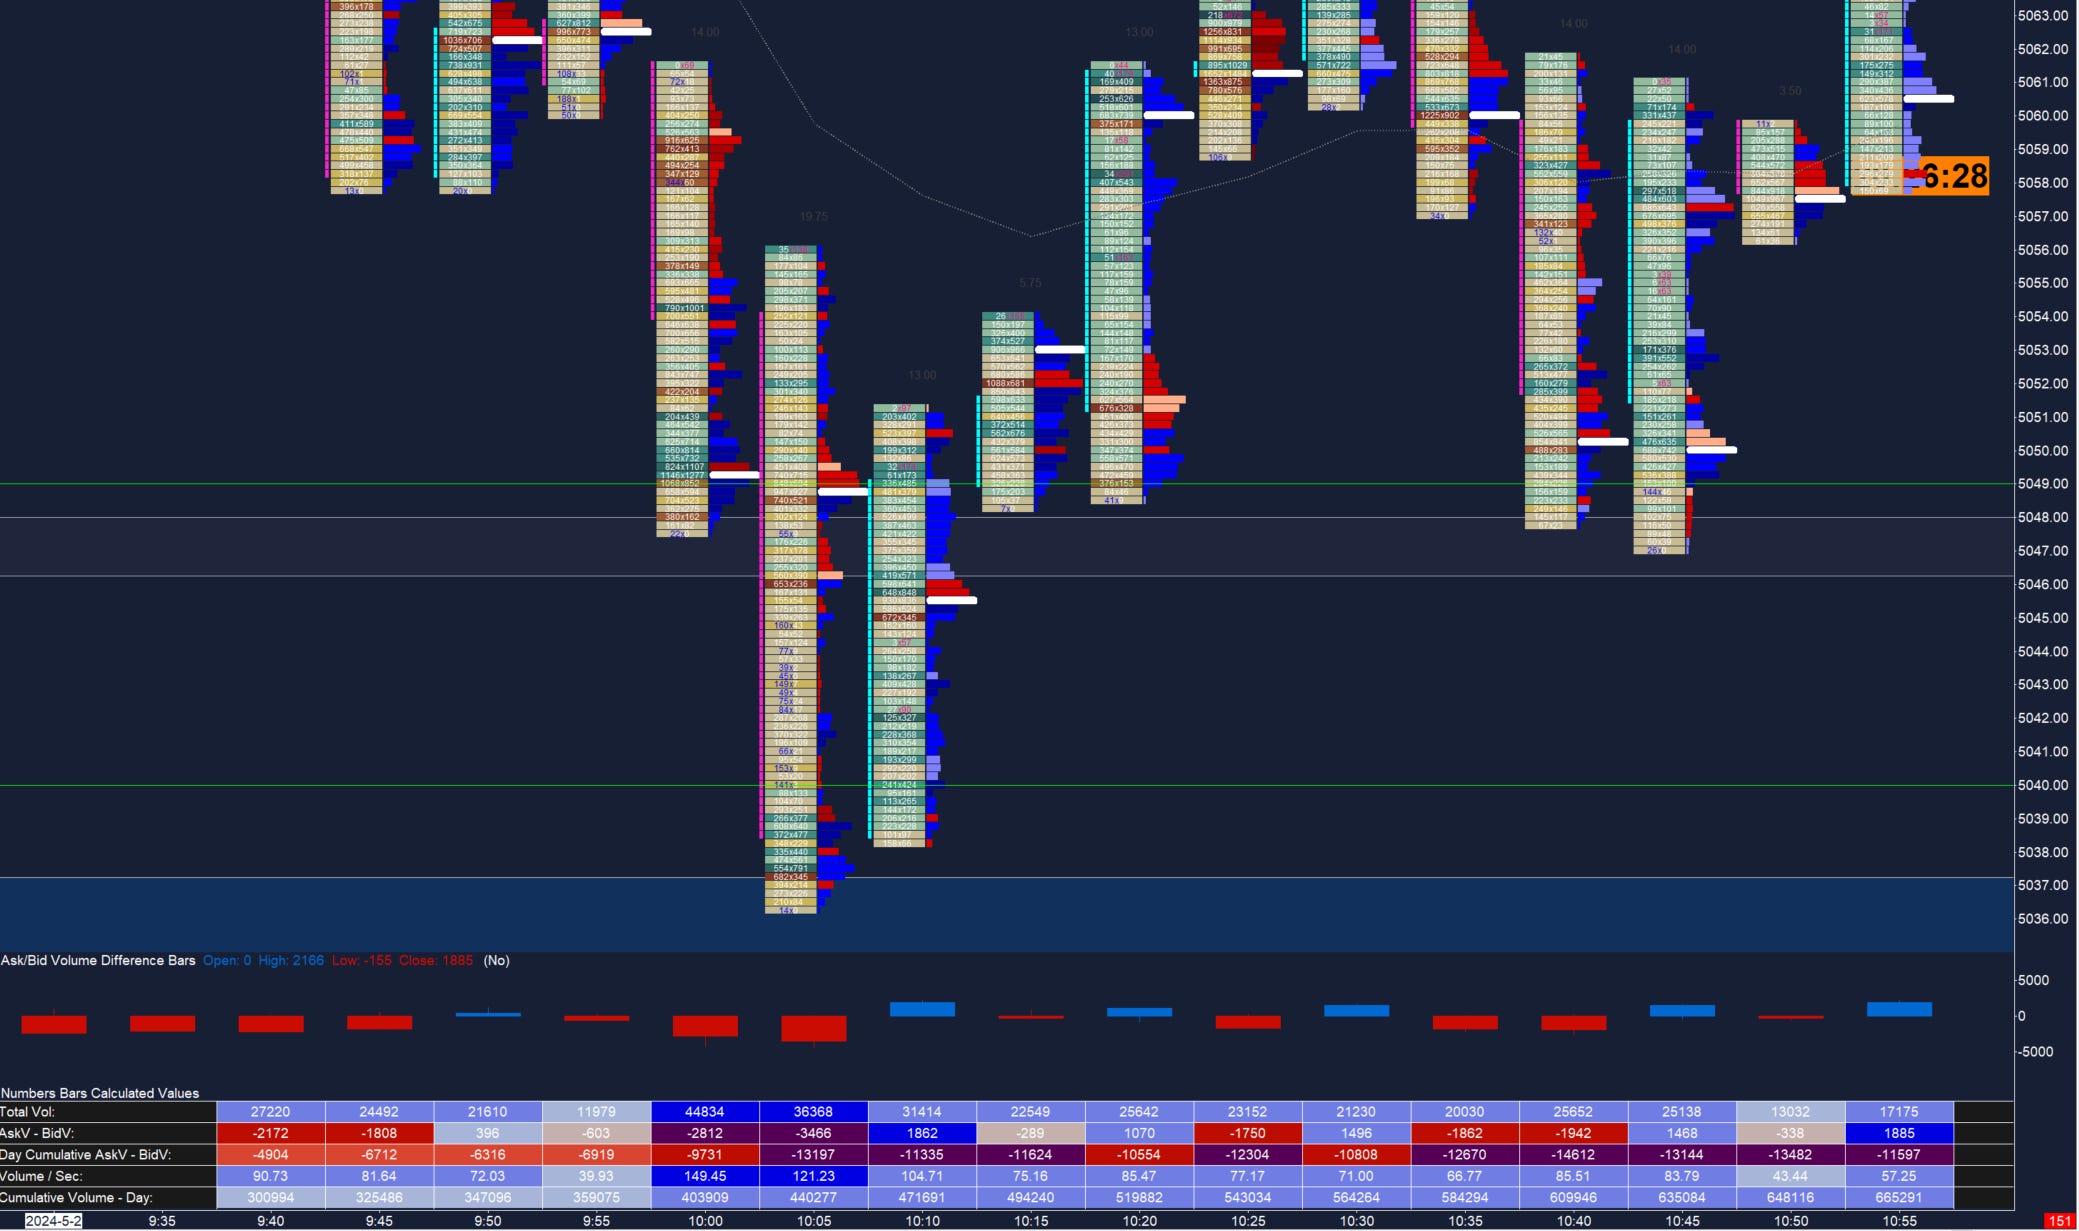
Selling delta is strong coming into the session as sellers take early initiative. Volume is especially heavy on a 20+ point push to the downside. This is often the range of entire sessions in just 10 minutes! Note the two liquidity areas (grey and blue bands) tagged. These were not adjusted after the fact, but zones I frequently update on Twitter. Make sure to subscribe, link below.
Note the strong bid at the lows (heavy blue delta), along with a flip in delta from red to blue. The fact that there are little passive buyers along the way (heavy red delta) hint that buyers were standing aside waiting for better prices. The heavy bid at the lows found those prices with responsive buying. Seller exhaustion (note the blue highlighted prints within the candles) then created a vacuum which was easily bid through.
Bid Back Better!
The confirmation entry was in C period as sellers attempted initiation lower once more. However this time they could not encroach on the prior excess. Note the lack of heavy red delta prints as well as the volume taper at the low end of the candles. This presented an ideal entry, with stop just below the mid of the prior 5m excess, or at the lows, depending on your risk tolerance. The HOD was later over 50 points higher.
Image 3. ES 5m candle chart, May 2
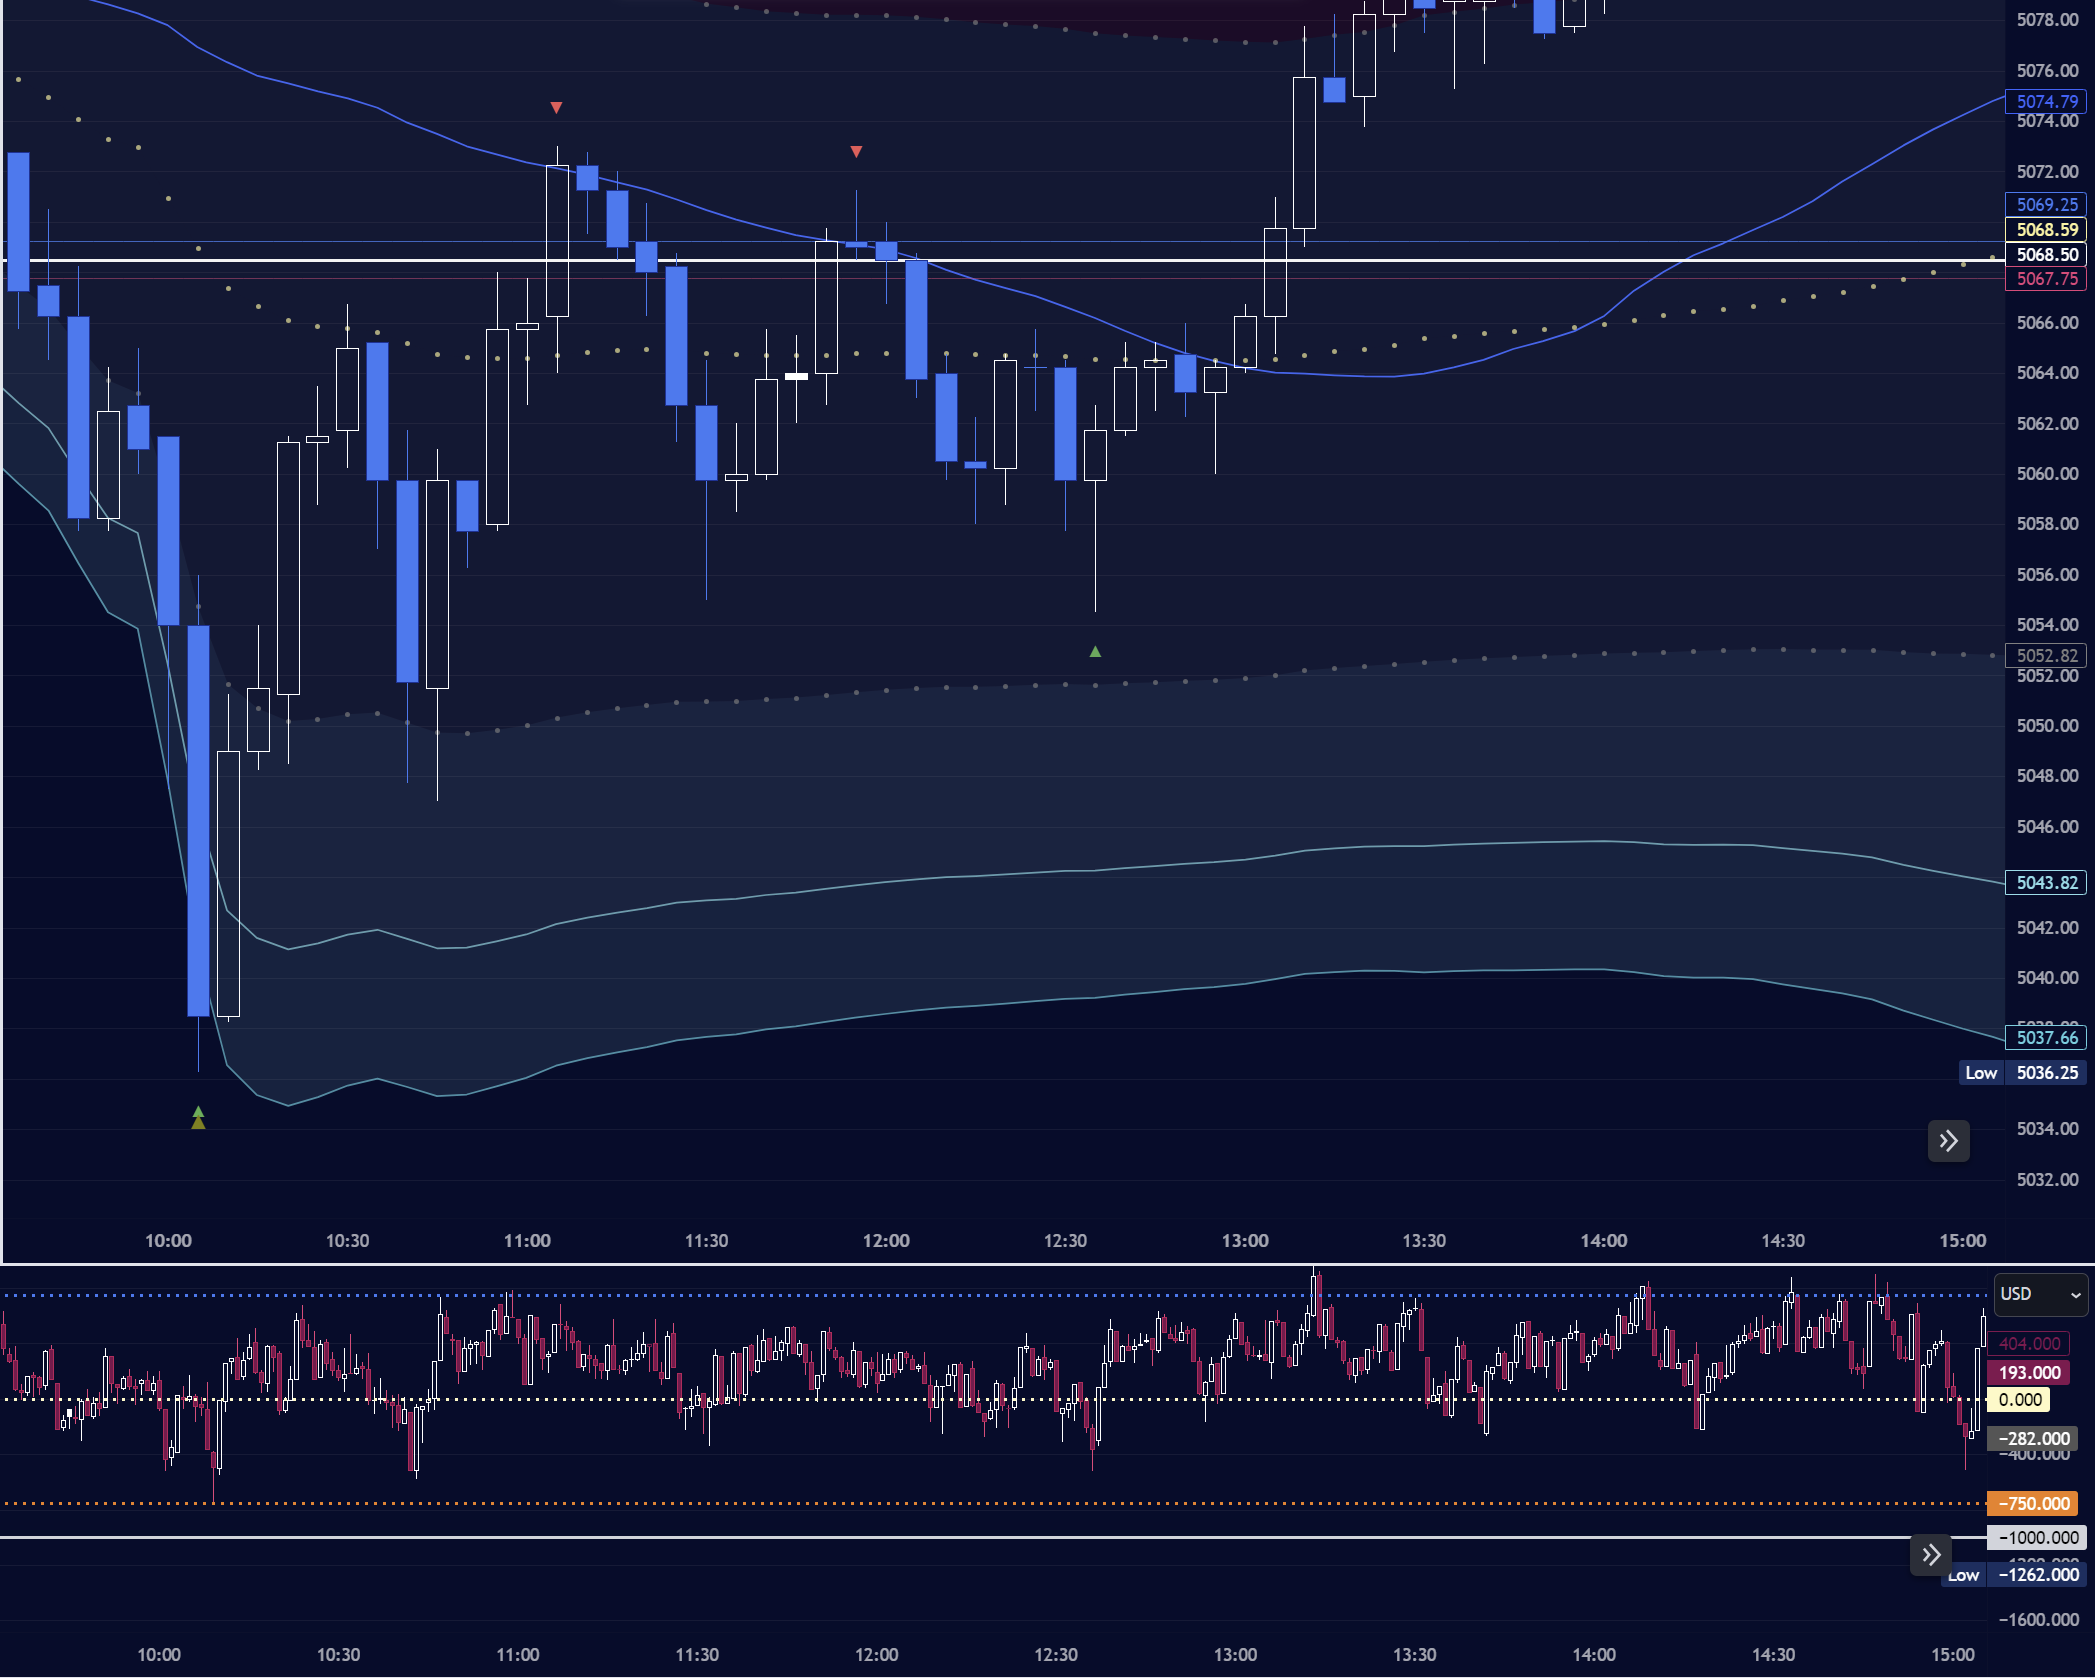
For the candle traders: I typically don’t see a need to go too granular as this can lead to overanalyzing every tick. Especially with regard to tradeable predetermined levels (which I share every day) - executing patience and correctly assessing tempo are more important qualities for profitable trading. These come with time.
In Image 3 above, note the sets of deep blue candles into the 5040 area. If volume is turned on you would notice a spike of volume at the low. However this is immediately bought up in the next candle, closing near the highs of that candle. The following five minute candle is a mini-auction (balance) closing at the high of the prior bid candle, and buyers then step in with more confidence.
Prices more often than not come to revisit prior areas of interest, and this was the case as sellers leaned on VWAP to retest the prior area of responsive buying. A sign of selling weakness was their inability to close within the body of the prior five minute mini-auction. Finally the next (10h45) candle opened and dipped lower only to trap sellers with barely a tick below the previous low and buyers once again stepped in. This was a great entry / confirmation long.
The Look of a Bid Part II
Remember, there are always more opportunities!
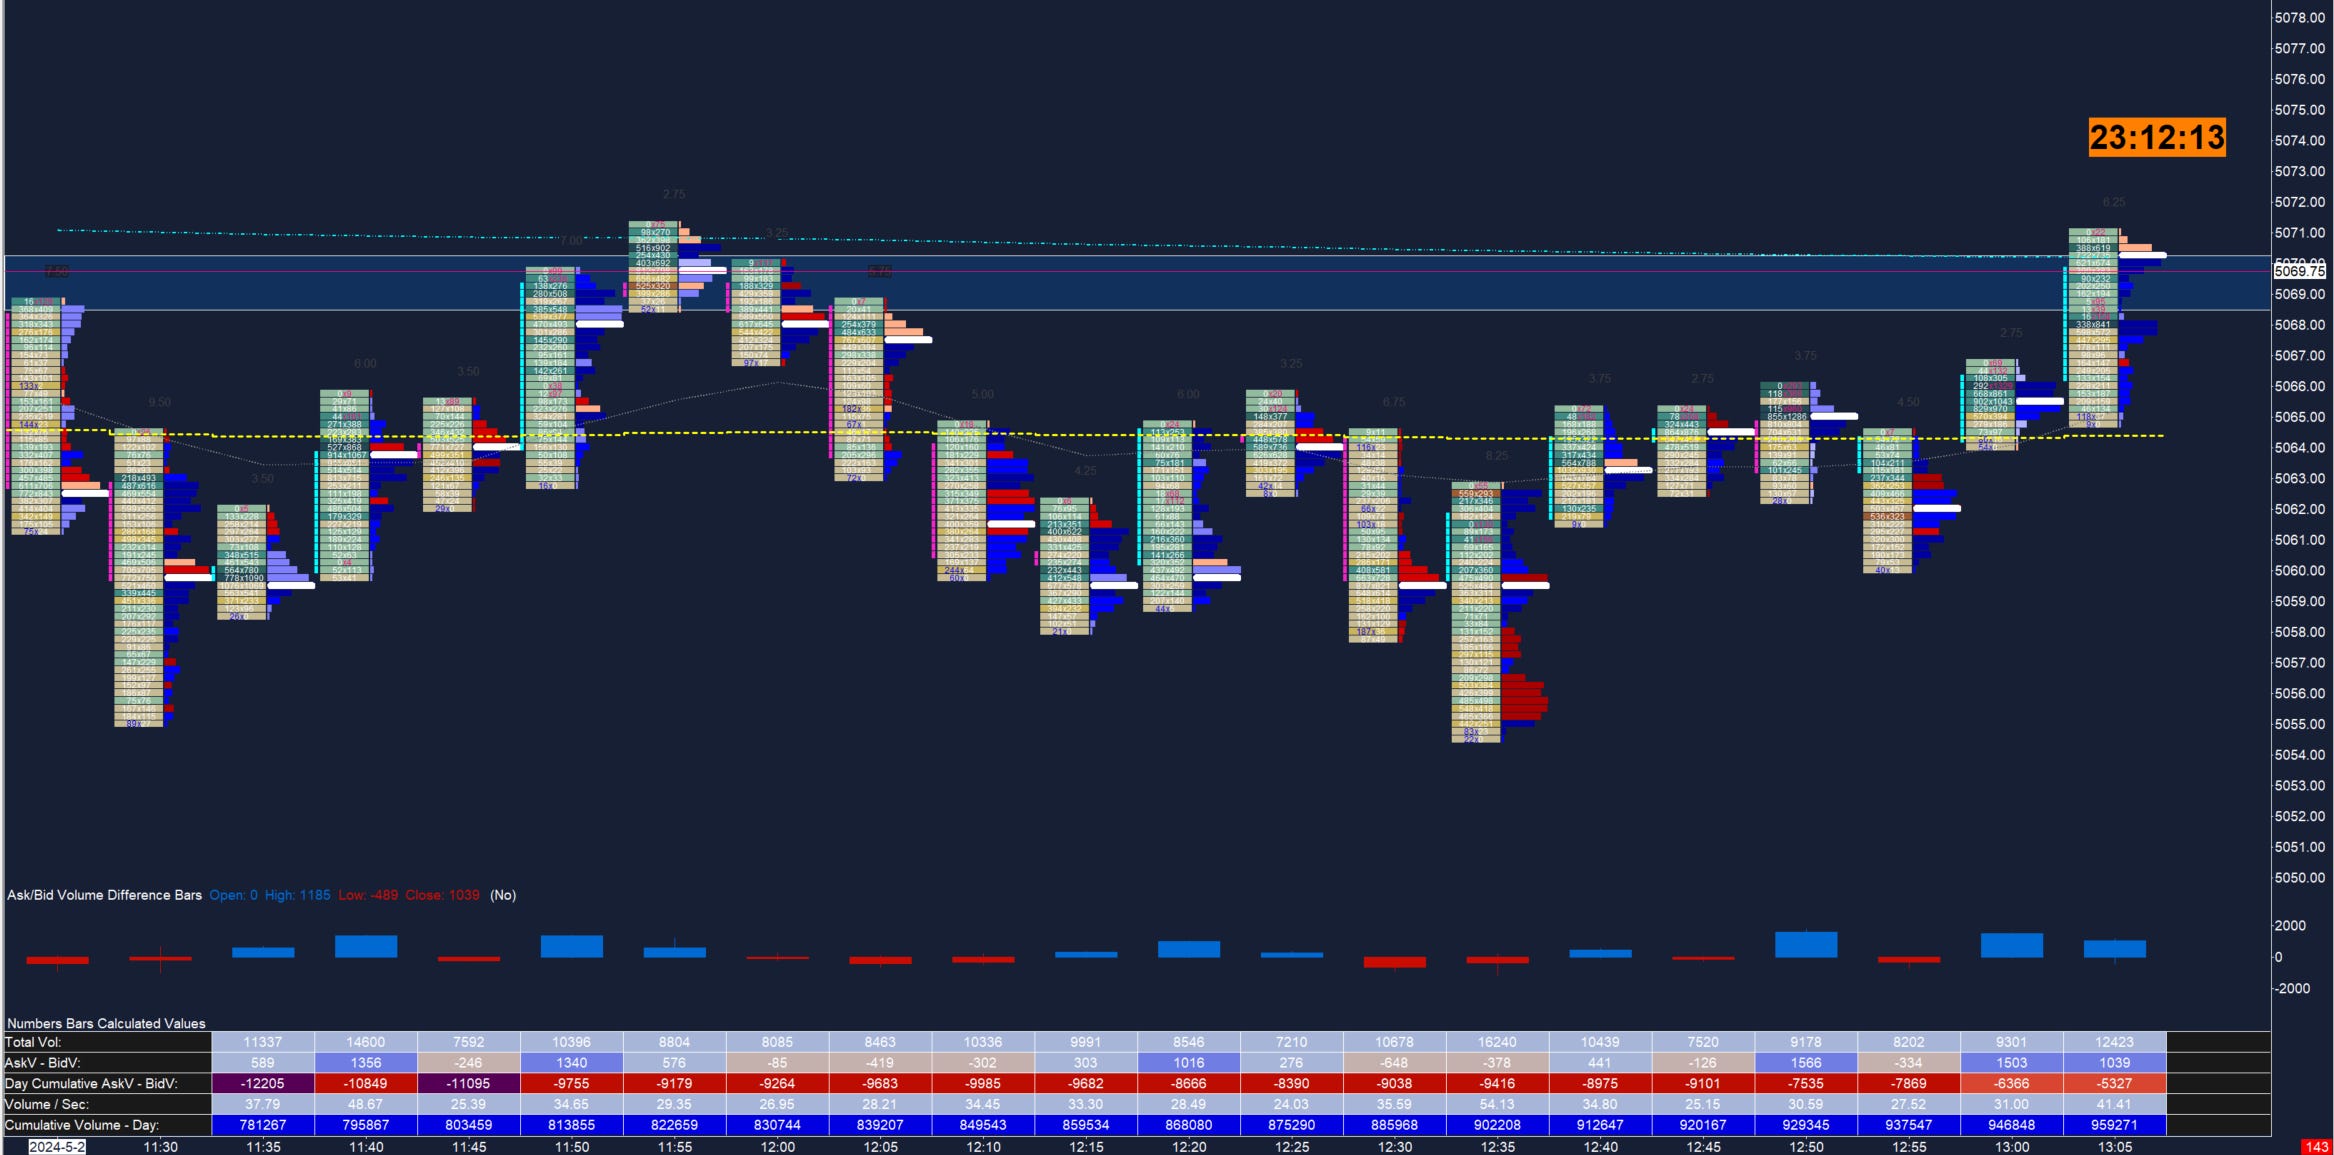
Following the morning excess, note the strong presence of buyers in the two-way auction. A lower low was indeed made in this balance area, but only two ticks of downside with seller exhaustion prints. Buyers stepped back in - a delta negative candle on a higher signals divergence and alerts to a potential entry.
That opportunity came with a final retest of the prior seller initiation attempt (12h55 candle). Note the lower relative volume, weak seller presence, inability to challenge the open of the 12h35 candle open, and the higher close on negative delta. This was a great entry with stop below the candle, or a confirmation to add to an existing long position.
Image 4. ES footprint, May 2, click to enlarge
Referring back to Image 3, note the rising TICK index from the morning into the early afternoon (lower chart area). The failed seller initiative candles - often referring to as ‘hammer’ candles - are a sign of exhaustion and potential reversal. Once again, the 12h55 candle - another deep hammer candle - closes on delta divergence after failing to challenge the open of the prior 12h35 candle.
Closing Notes
While not a setup per se, this primer on identifying exhaustion intraday is an important example towards recognizing which side is in control. Indeed the hammer candles, retests, or exhaustion prints may be a part of your setup; or with enough backtesting, on your way to a profitable one. This explains the mechanics behind it.
Here are more selected examples from the last few trading weeks on the five minute timeframe. They are less reliable on low volatility or trend down days, as you will see. I chose a range from very profitable to a loss. Nothing is guaranteed in trading so it is important to study failures as well.
Image 5. Selected rebid setups
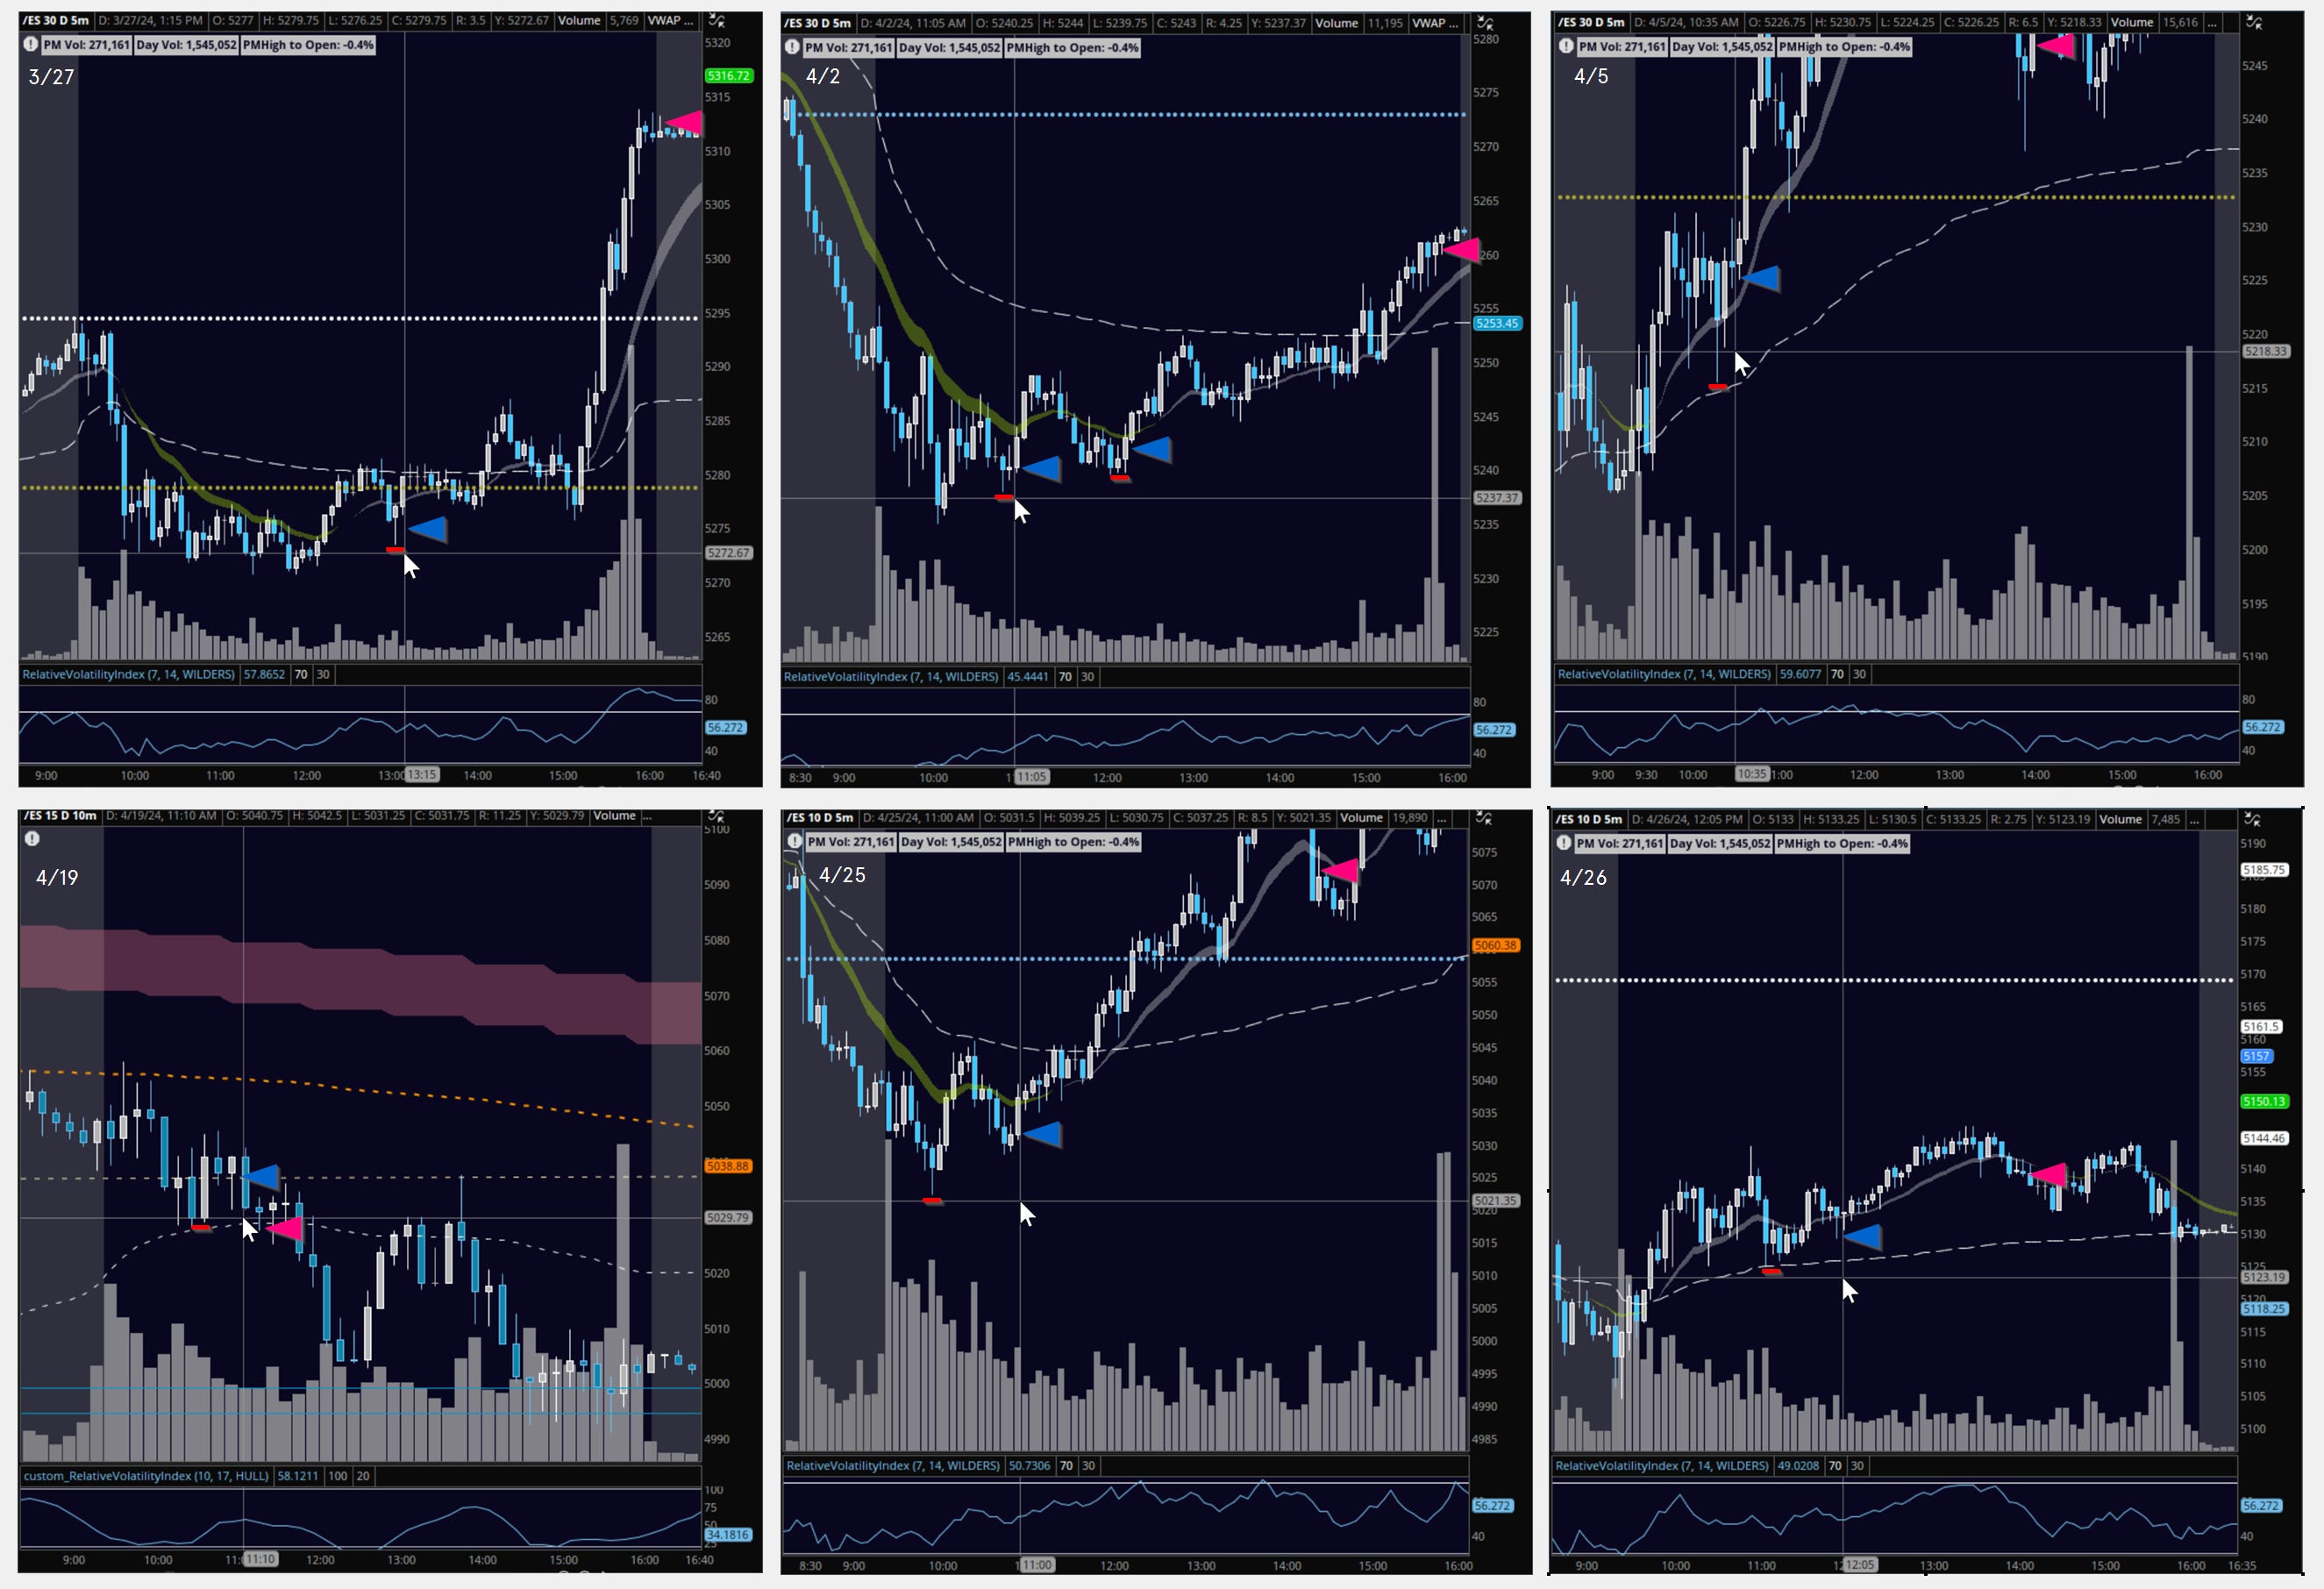
I stress the importance of zooming out and gauging what prices the market is rejecting or accepting - as day traders we are at risk of losing sight of the big picture, overanalyzing every tick of movement on short timeframes. Not only do you potentially miss big moves, you lose the narrative of what is actually playing out in front of you.
Have I improved your trading? This journal remains free, but you can support my work , by liking and commenting, sharing my work with friends or on Twitter (X) - and certainly directly with a contribution. I appreciate your support: it keeps my publication ongoing and timely!
Tip jar

Be sure to follow me @rareverend on X (Twitter) for the latest updates.
Don’t maintain bias in the face of contradicting information! Capital preservation is key.
This is CERTAINLY not investment advice and I am not a qualified licensed investment advisor nor a minister of the church. All information found here, including any opinions, commentaries, jokes, outright mistakes, and suggestions - expressed or implied herein - are for informational, entertainment or educational purposes only and should not be construed as personal investment advice. While the information provided is believed to be as accurate a picture of trade as I see it, it is after all how I see it and errors or inaccuracies are practically expected. I will not and cannot be held liable for any actions you take as a result of anything you read here. As always, conduct your own due diligence, or consult a licensed financial advisor or broker before making any and all investment decisions. Any investments, trades, speculations, or decisions made on the basis of any information found on this site, expressed or implied herein, are committed at your own risk, financial or otherwise.