
Price Action Analysis: May 21, S&P500
Footprint Primer
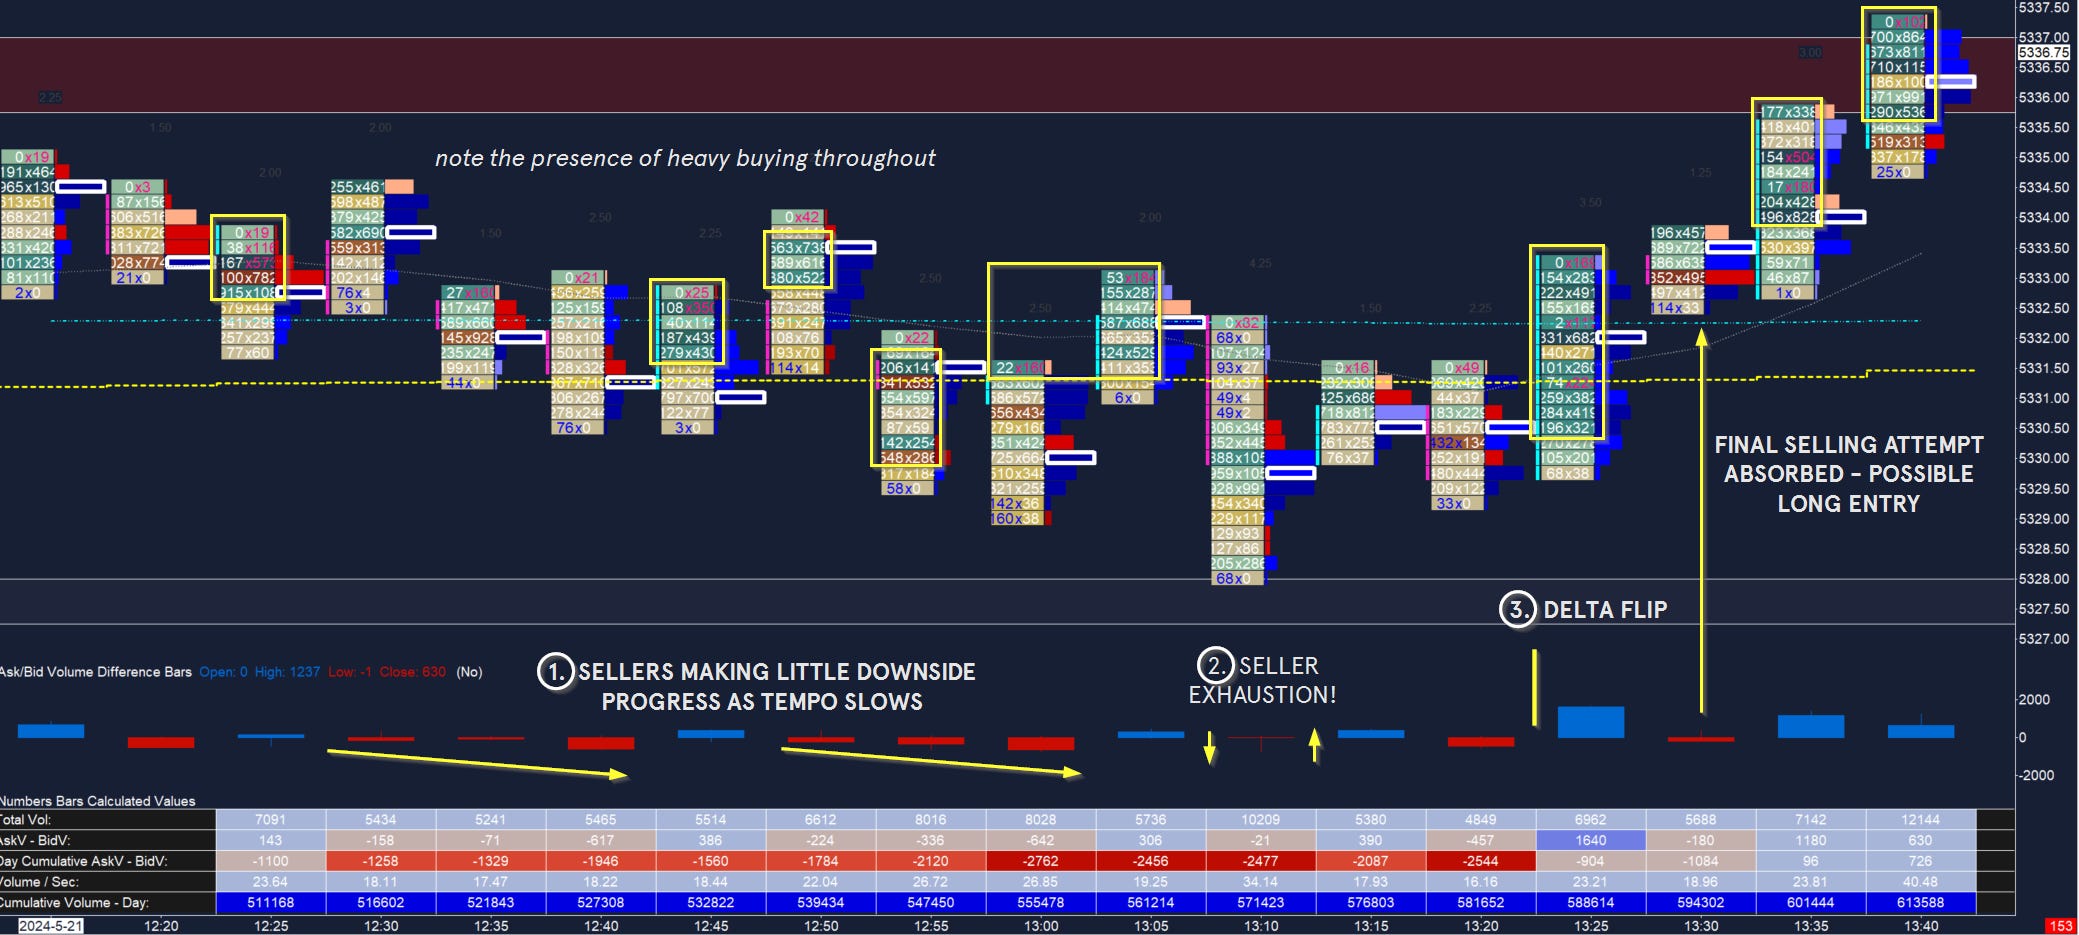
Image 1. ES 5m footprint, May 21
The footprint is a unique tool, allowing you to see the ‘x-ray’ of each candle. This is the volume within each candle both on the bid and the offer, allowing you to interpret the order flow. This method reveals unique clues that a traditional candle chart does not show - although this tool is certainly not necessary for good trading (I personally know successful traders who can churn out consistently banger trades from their phone screen), it can certainly be a useful addition to your toolkit.
Referring to the image above - seller presence was muted coming into the lows - note the relatively neutral delta with slight seller bias. Selling efforts were not making much headway in price. This was an initial suggestion of divergence: the astute trader may be looking for signs of exhaustion at this point. Note the very slow tempo - on an already very slow day.
The presence of consistent buying is visible in the heavy blue delta, indicating buyer interest. Buyers may simply be holding out for better prices - rather than a committed selling effort.
Sellers initiate into the day’s pivot 5328 in an apparent attempt to take out the day’s open. Note the total lack of selling volume! Although the 5m candle closes lower, almost all selling delta is absorbed.
Sellers then languish as tempo slows further. Note how volume completely shuts off at the 13h15 and 13h20 candles! For now both participants are standing aside, waiting for the next move.That comes with the delta flip as buyers flood the offer side (heavy blue delta). Price closes higher in advance of the period flip. A weak selling attempt at the start of I period is absorbed; this is a great opportunity to jump on the long trade into the close. This is the ‘late-day fade’ setup I have shared before.
Buying delta continues to increase along with volume as price pushes out of the lows. The day closes near ATHs with a near 20 points higher.
Keep it simple - don’t overthink it!
Have I improved your trading? This journal remains free, but you can support my work , by liking and commenting, sharing my work with friends or on Twitter - and certainly directly with a contribution. I appreciate your support: it keeps my publication ongoing and timely!
Tip jar

Be sure to follow me @rareverend on X (Twitter) for the latest updates.
Don’t maintain bias in the face of contradicting information! Capital preservation is key.
This is CERTAINLY not investment advice and I am not a qualified licensed investment advisor nor a minister of the church. All information found here, including any opinions, commentaries, jokes, outright mistakes, and suggestions - expressed or implied herein - are for informational, entertainment or educational purposes only and should not be construed as personal investment advice. While the information provided is believed to be as accurate a picture of trade as I see it, it is after all how I see it and errors or inaccuracies are practically expected. I will not and cannot be held liable for any actions you take as a result of anything you read here. As always, conduct your own due diligence, or consult a licensed financial advisor or broker before making any and all investment decisions. Any investments, trades, speculations, or decisions made on the basis of any information found on this site, expressed or implied herein, are committed at your own risk, financial or otherwise.
How do you spot absorption on footprint charts?
Isn't delta divergence absorption or is it something else?
Thank you