
Price Action Analysis: August 26, S&P500
Footprint Primer / Look Above and Fail
Image 1. ES TPOs, Friday RTH to Monday ETH and RTH

This week and next I will be laying the groundwork for the Look Above / Below and Fail setup, or LAF / LBF. This is one of my three core setups, with an average win rate of 60% and a high R:R. As successful traders know, there is no such a thing as a guarantee in trading - except losses which are a guaranteed normal part of the game.
Just keep them small.
You would do well with a win rate of 50% and an R:R of 2.1 as you would come out ahead over time. Even an R:R of 2.01 but you that’s a thin margin. Similarly you could have a 20% win rate and a 6 R:R and be in the green. However a 79% win rate with 0.2 R:R and eventually you’ll blow your account. It’s simple algebra. The key is to find a few, consistent setups that you can effectively execute. The more mechanical and thus objective, the better. Although it is usually not a good idea to take trade blindly - unless your system is designed that way, and back tested to come out ahead.
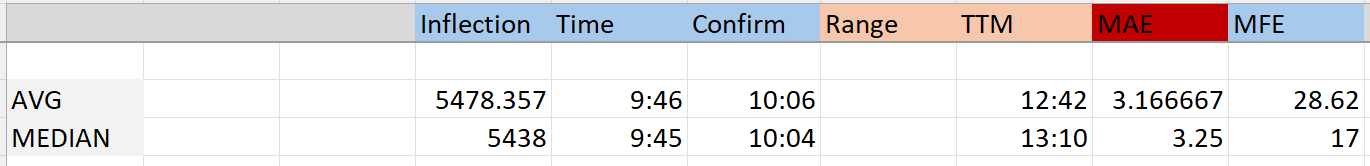
Image 2. Sample from the LAF/LBF stats for Q2 2024
I will detail these core setups in the months ahead with subscribers, sharing up-to-date stats as well as the rules for each. Monday was a great example of the LAF setup, as prices ‘looked above’ the overnight (ETH) and prior day highs (PDH) - but these higher prices were rejected as ‘unfair.’ Sellers saw this as an opportunity to offload inventory. With weak demand below, prices moved to the opposite side of the prior day value area - and below! - before stabilizing just under the prior day point of control (PDPOC).
Let’s dive into analysis.