
Price Action Analysis: April 4
Look above and fail for a 100 point move.
Image 1. Week of April 1 - April 4, daily profiles / TPOs
A follower asked about the look above and fail (LAF) setup last Thursday. This was a great question to lead to a primer, as that move gave over a 100 points - a near 2% move in the index!
I. Profile. Taking a look at the image above, The RTH open (A period) begins with a push into poor structure above - the singles from Monday. This is quickly rejected as sellers trade back through the open. With buyers unable to continue above the singles, a sign of weakness, this is a great level to lean against - with stop above the A period high.
Generally a look above and fail scenario should not spend much time above the key level of reference, in this case the open. Time is something that is relative and dependent on the timeframe, and nothing that can be taught. This is learned by months (and years to get good gut feeling) of watching tape.
The second opportunity came at the lunch period, with a look above and fail of the IBH. This was an attempt by buyers to trade into Monday’s open - however falling short. A series of lower highs on the 30m confirms weakness. A short could lean against a previous period high, with stop above the HOD.
Time and profile / TPO is a powerful combination.
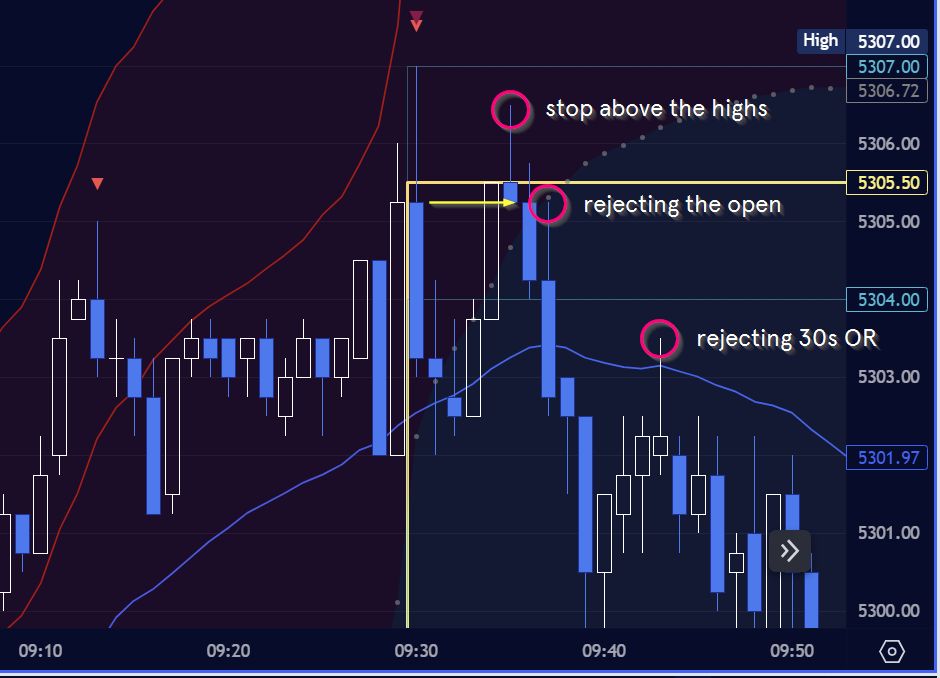
II. Candle. Following the failure of buyers to trade above the singles, the astute trader could short the move back through open, or a test of the open and / or the 30 second opening range from below (also a failure to retake the ONH). Note the series of lower highs and seller pressure in the form of consecutive strong sell (blue, on my charts) candles. Observe the wicks
Image 2. Thursday open, 1m candle chart
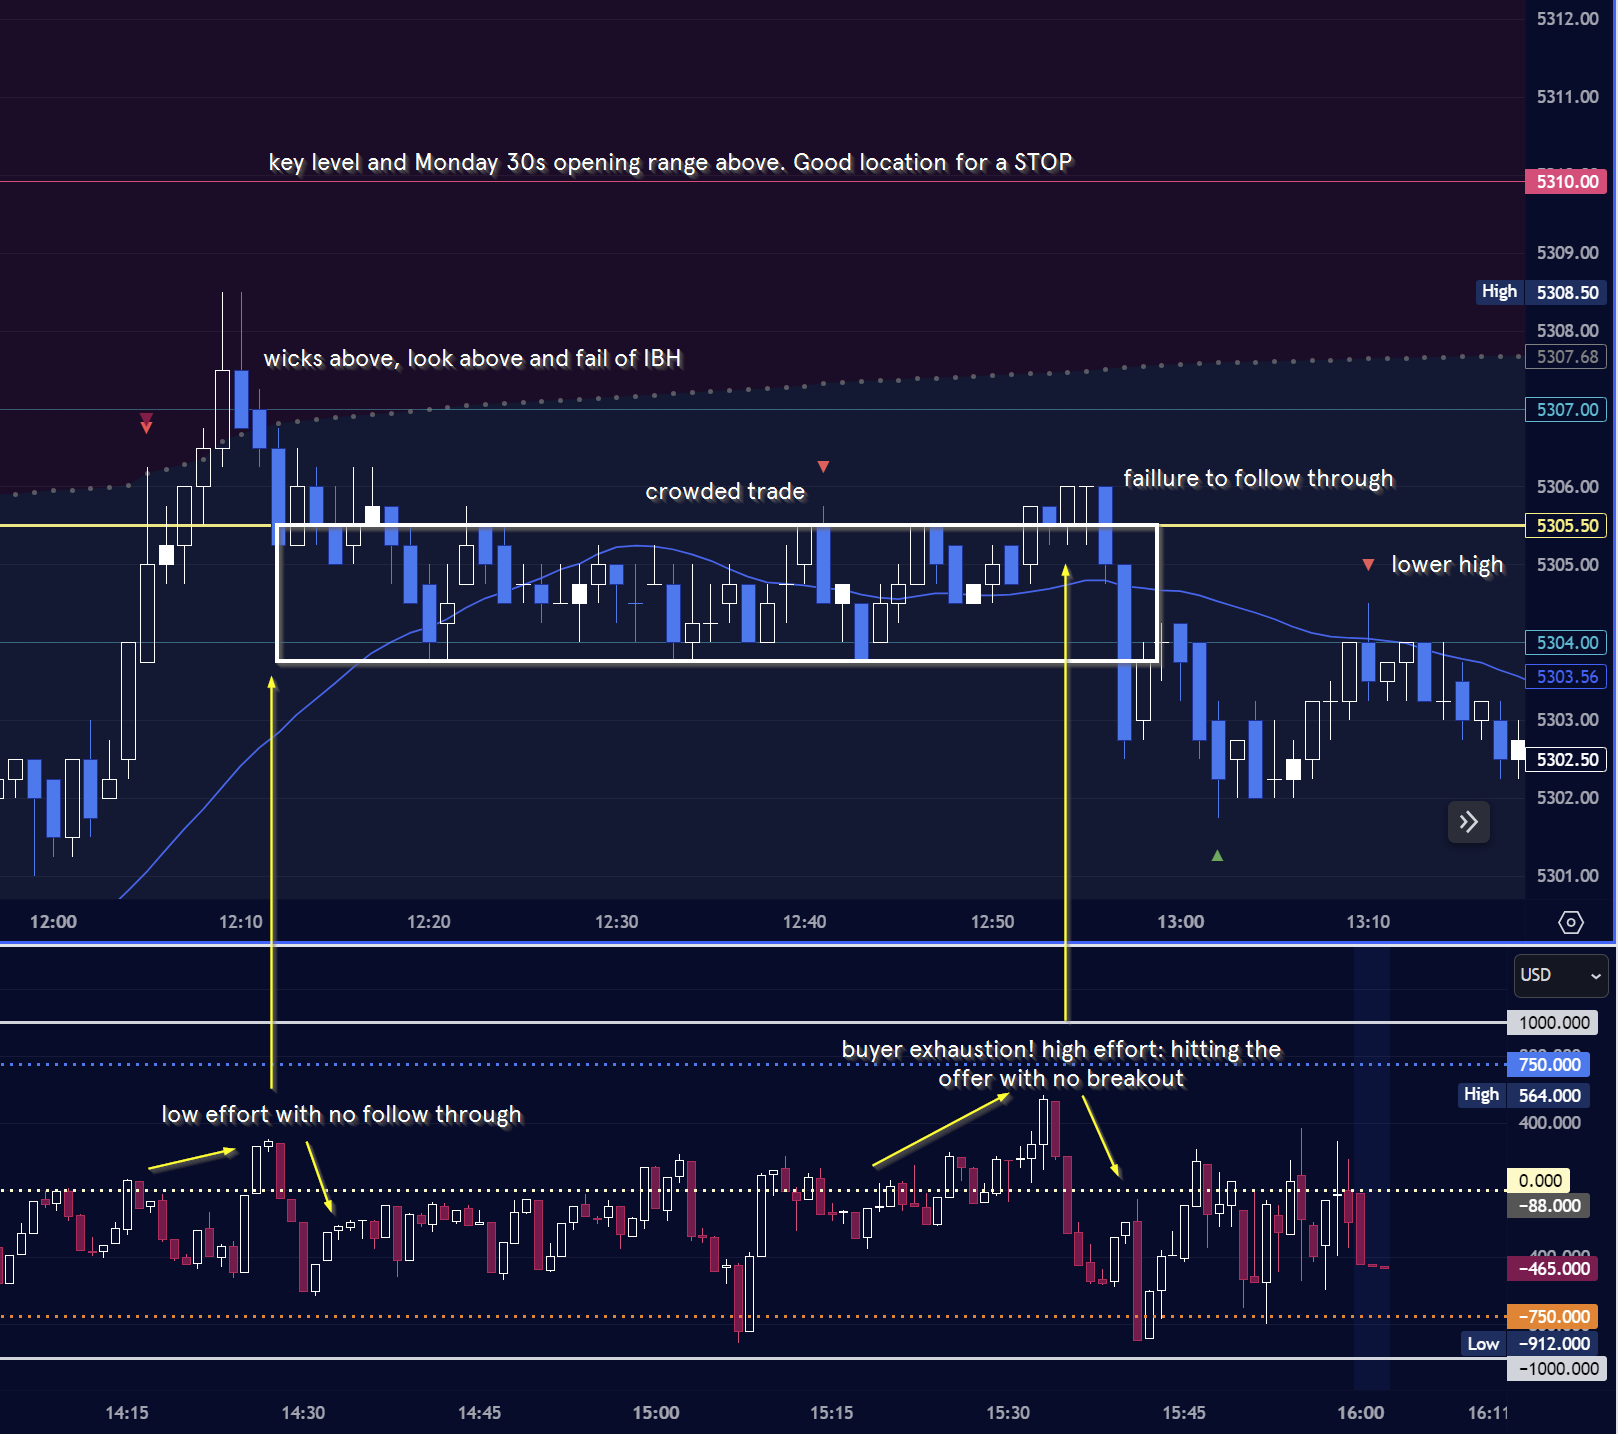
The second opportunity came later in the morning after the European close. Finding support just below the IB, buyers bid into a break of the morning high. For anyone who did not take profit, this might be a good reason to exit.
However trouble once again manifested for the buyers. This push may be considered a ‘rescue mission’ into Monday’s trapped buyers. A good reference here was Monday’s opening level and / or 30 second opening range. Not only did buyers fall short of the opening level, a series of lower highs on the 30m confirmed weakness. This was the second LAF setup.
Note the subtleties in the TICK (subgraph). Buyers on the first try retract from the offer side after what seemed a promising push. For those watching the IBH, a stop could be placed above Monday’s opening level as this was the natural target for buyers.
With no follow through, buyers then spent nearly a hour in place, a final strong effort on the offer side (see TICK) sees little price movement to the upside. Beware of crowded trades, don’t be the sheep to slaughter! This is an indicator of strong seller presence, leading to absorption and buyer exhaustion. A stop could be placed against the HOD.
A lower high on the 30m confirms weakness.
Image 3. Thursday highs, 1m candle chart
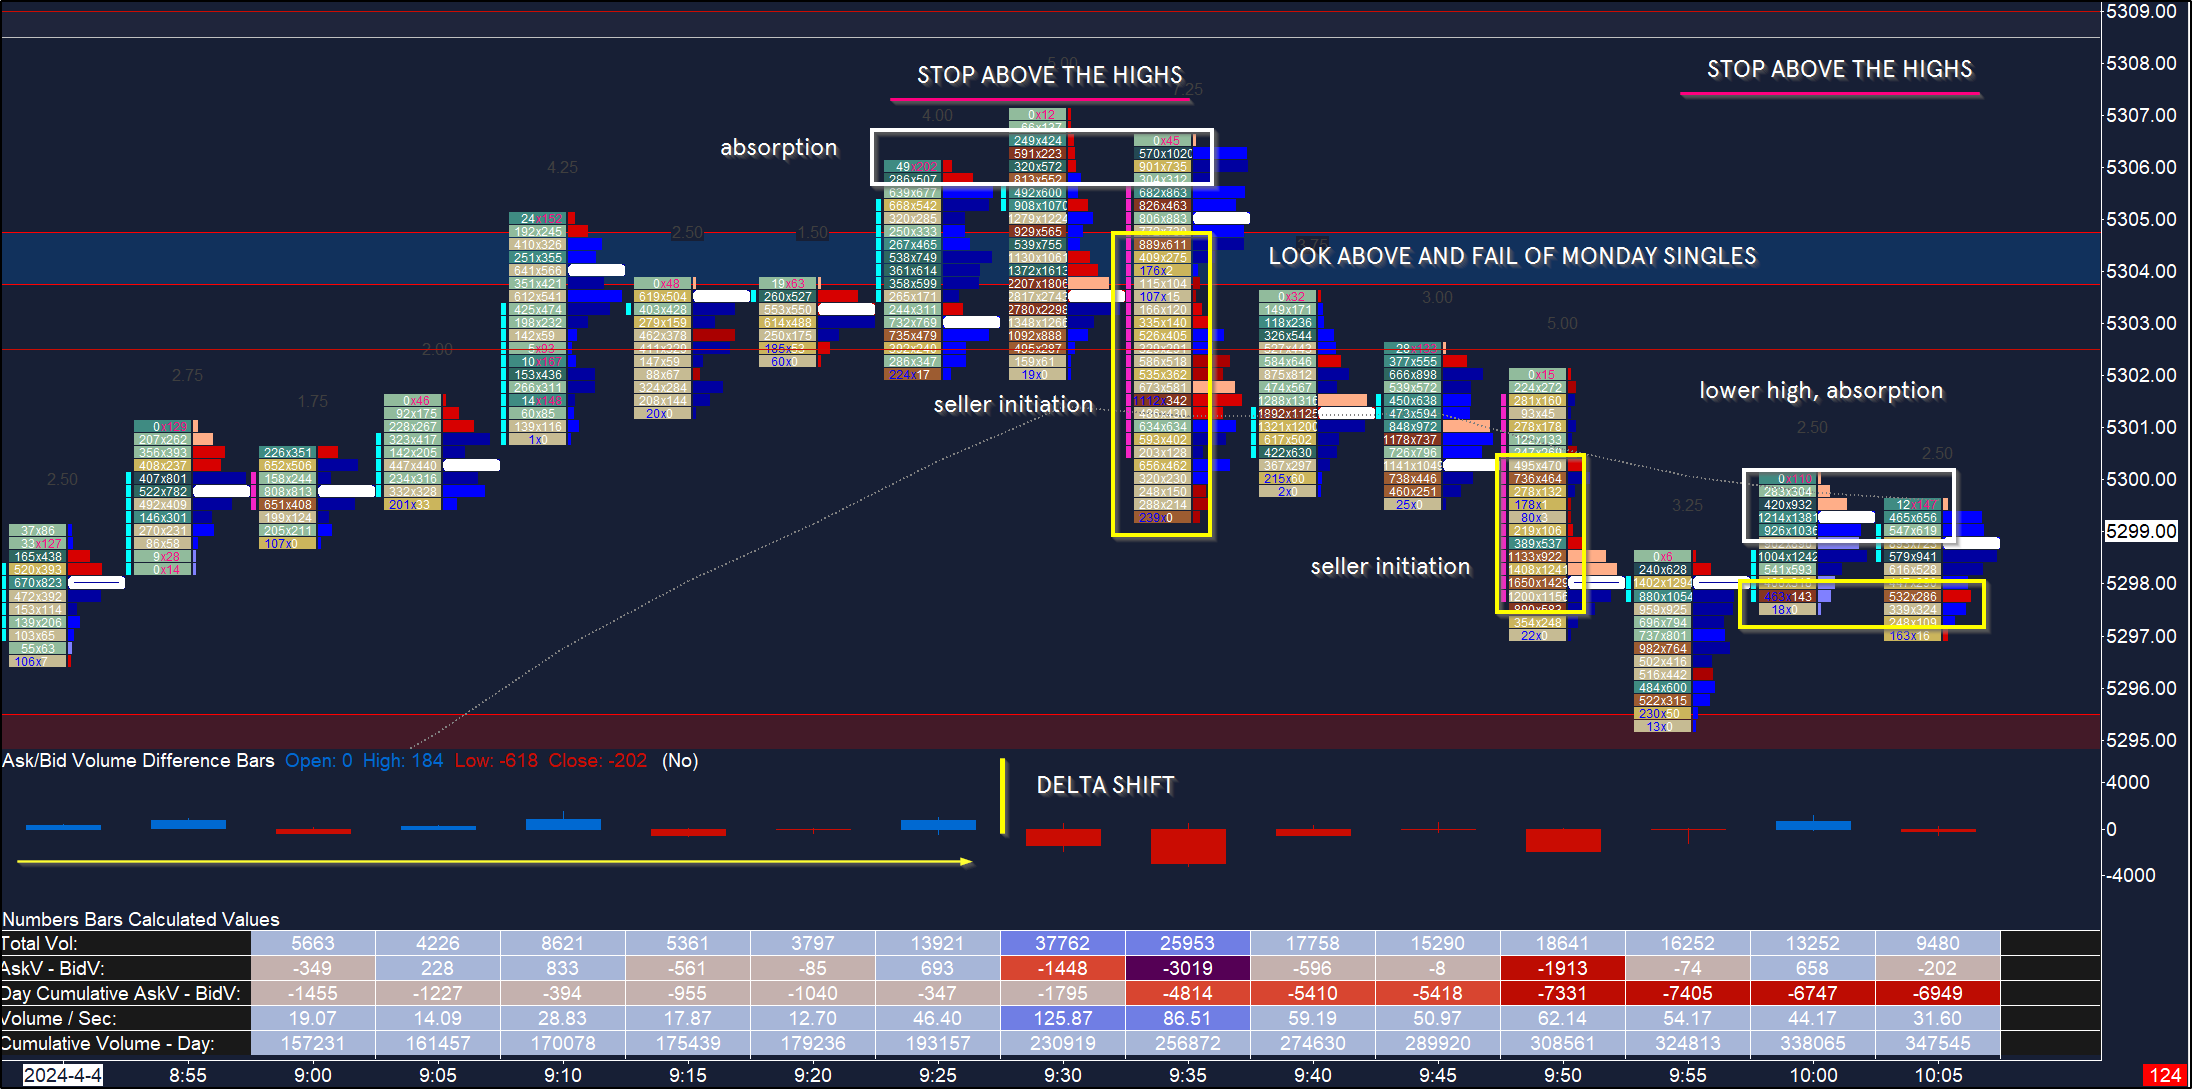
III. Footprint. This offers an ‘x-ray’ view of the candles. Note the absorption at the highs and strong selling delta and delta shift as tone has changed. A stop above the absorption at the highs is a good lean short as sellers initiate below the open.
A later lower high (and lean against psych level 5300) is another possibility although a potentially wider stop.
Image 4. Footprint chart, 5m
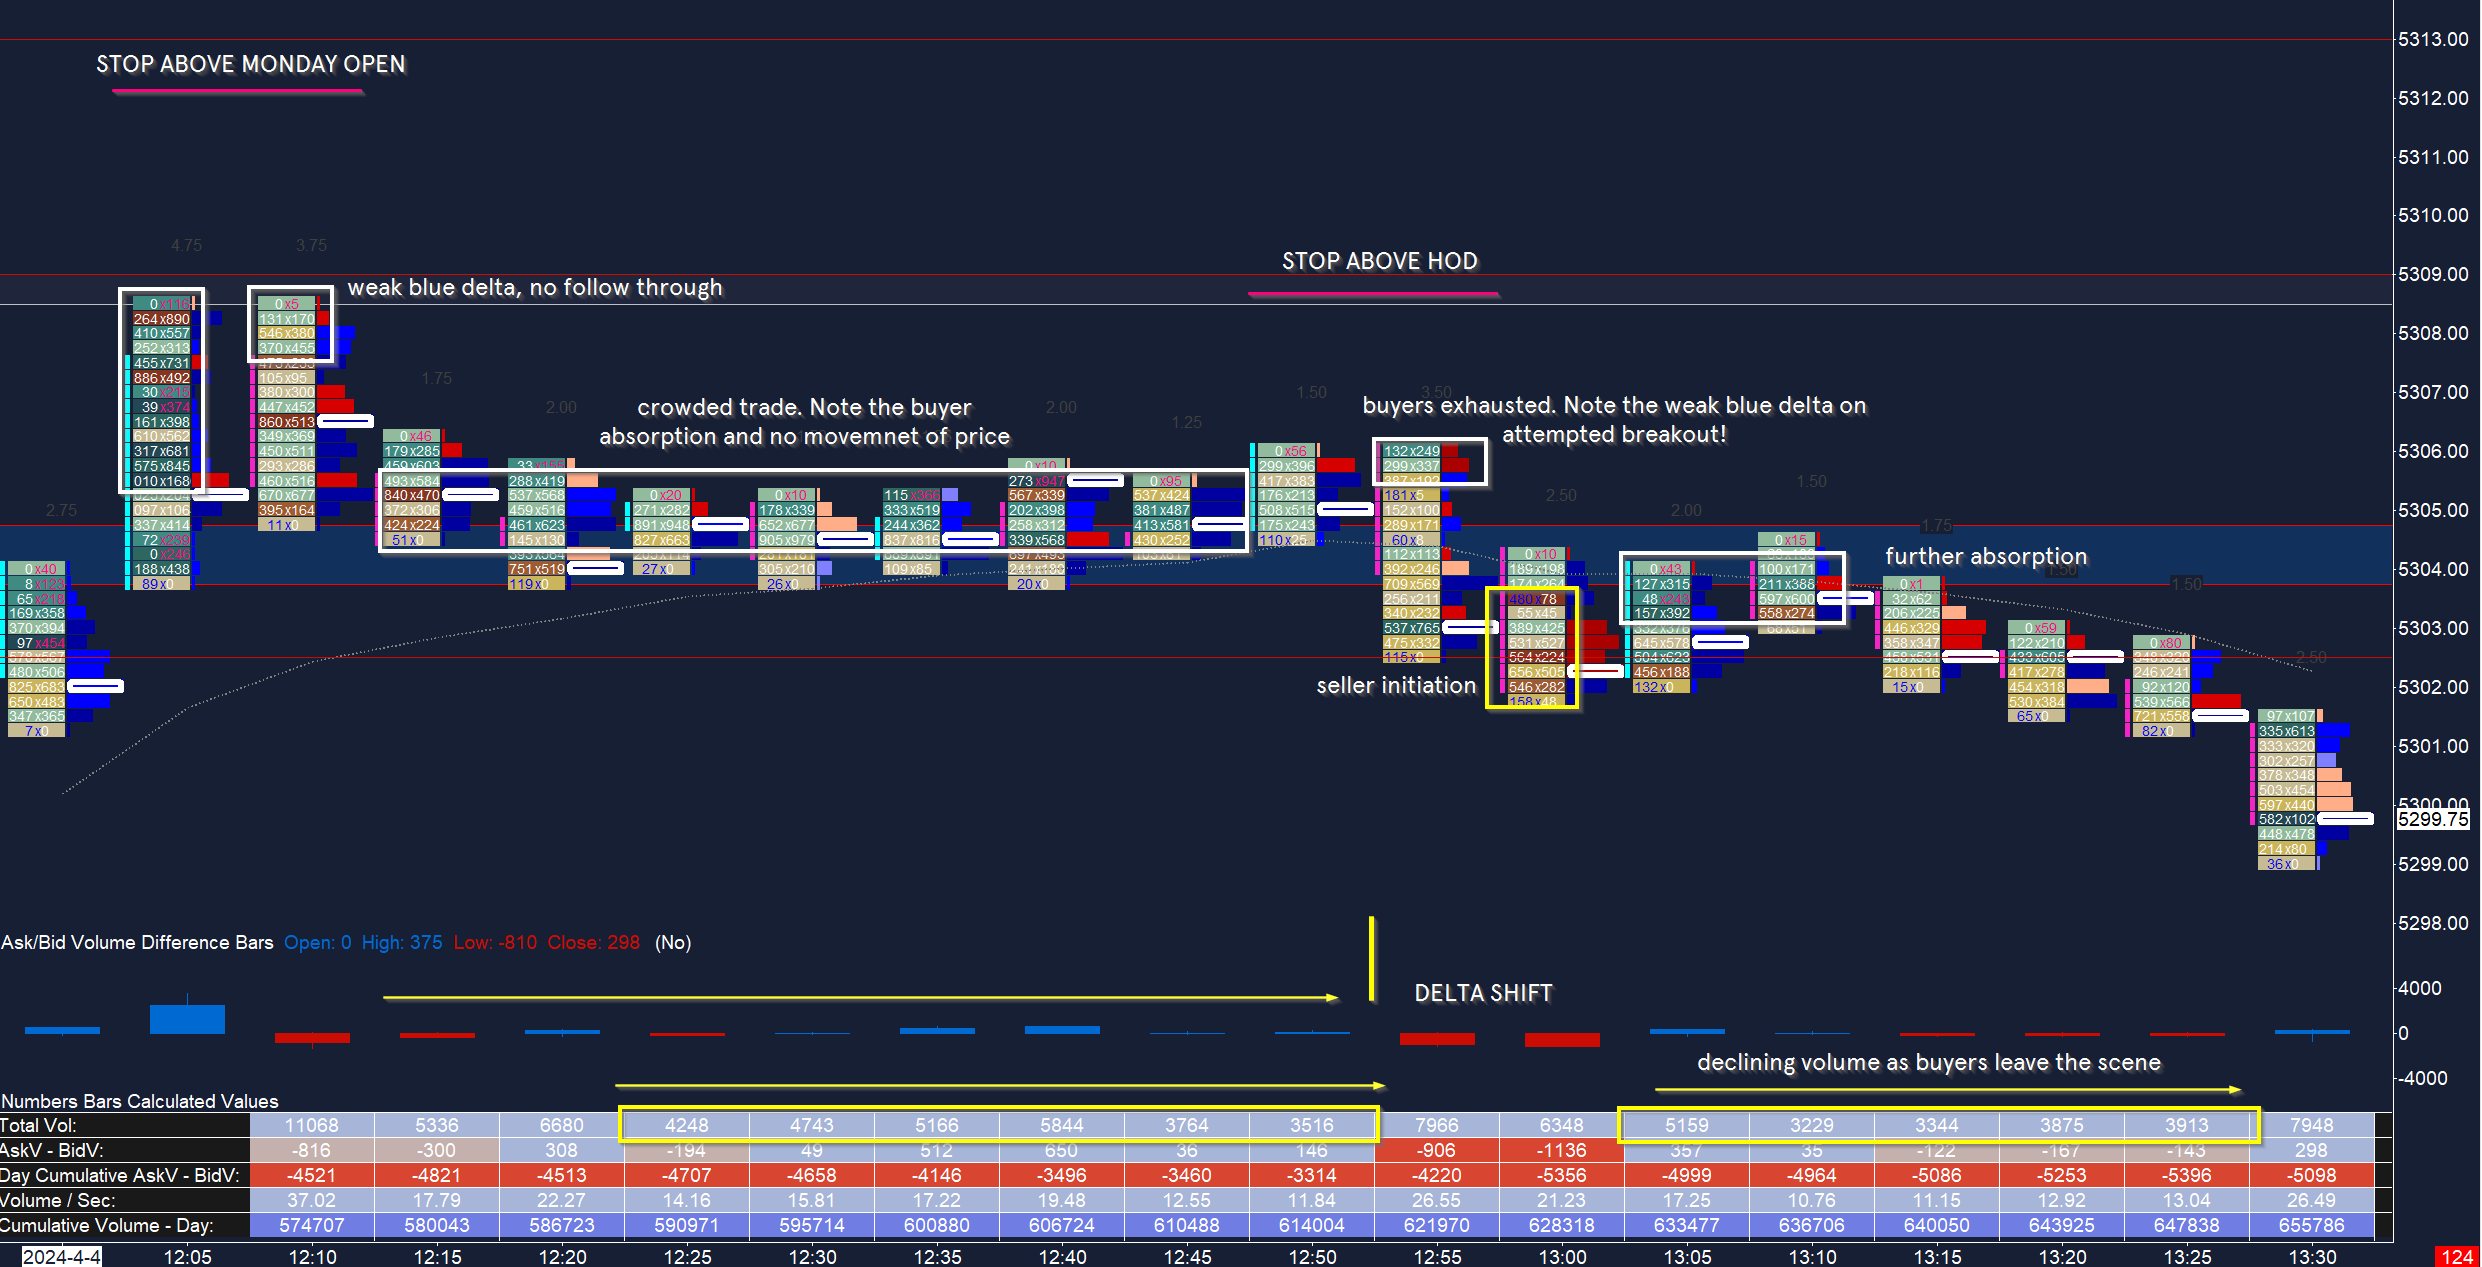
Finally taking a look to the day’s high, note the buyer absorption over the course of an hour. This is a strong indicator of seller presence - further confirmed by declining volume as the high prices shut off trade.
Image 4. Footprint chart, 5m
I hope this helps!
Have I improved your trading? This journal remains free, but you can support my work , by liking and commenting, sharing my work with friends or on Twitter - and certainly directly with a contribution. I appreciate your support: it keeps my publication ongoing and timely!
Tip jar

Be sure to follow me @rareverend on X (Twitter) for the latest updates.
Don’t maintain bias in the face of contradicting information! Capital preservation is key.
This is CERTAINLY not investment advice and I am not a qualified licensed investment advisor nor a minister of the church. All information found here, including any opinions, commentaries, jokes, outright mistakes, and suggestions - expressed or implied herein - are for informational, entertainment or educational purposes only and should not be construed as personal investment advice. While the information provided is believed to be as accurate a picture of trade as I see it, it is after all how I see it and errors or inaccuracies are practically expected. I will not and cannot be held liable for any actions you take as a result of anything you read here. As always, conduct your own due diligence, or consult a licensed financial advisor or broker before making any and all investment decisions. Any investments, trades, speculations, or decisions made on the basis of any information found on this site, expressed or implied herein, are committed at your own risk, financial or otherwise.
Dang, man....Gold is gonna cruise then, huh? I'm seeing 2284 and 2340 as far as pullback areas within the current channel....it could ride that channel for a long time, man. Let me/us know if you see something....What is TPO?
When you mention IB you are referring to the first hour....completed?
Wicks really do tell a story...the more I read your missals and the more I watch on a smaller time frame, the more I see. I still am a better swing trader but I am slowly understanding the picture. I really, really wish I would have bought some gold futures when you mentioned that a few weeks ago. I think it was starting on a Sunday evening and I regret not buying then. You were spot on. Excellent job!