
May 31, S&P500 Premarket Plan and Missal
Subsmission
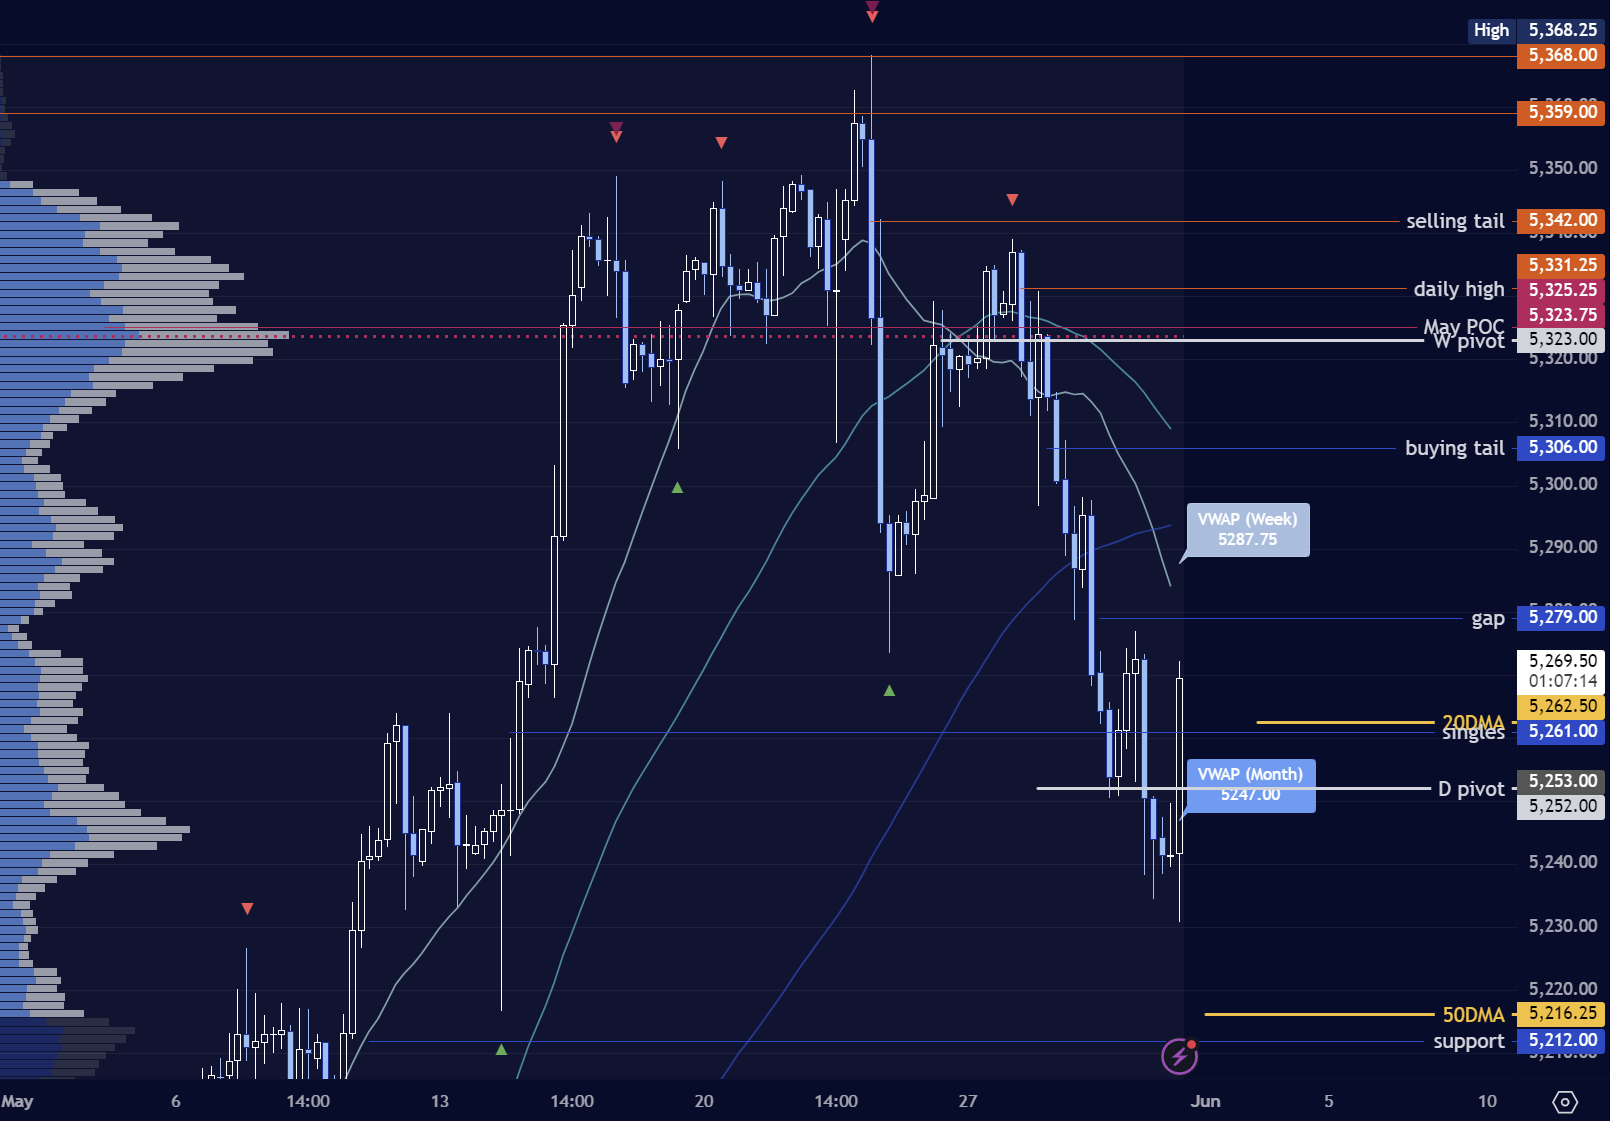
Image 1. ES profiles, RTH Thursday to ETH Friday as of 8h35EST
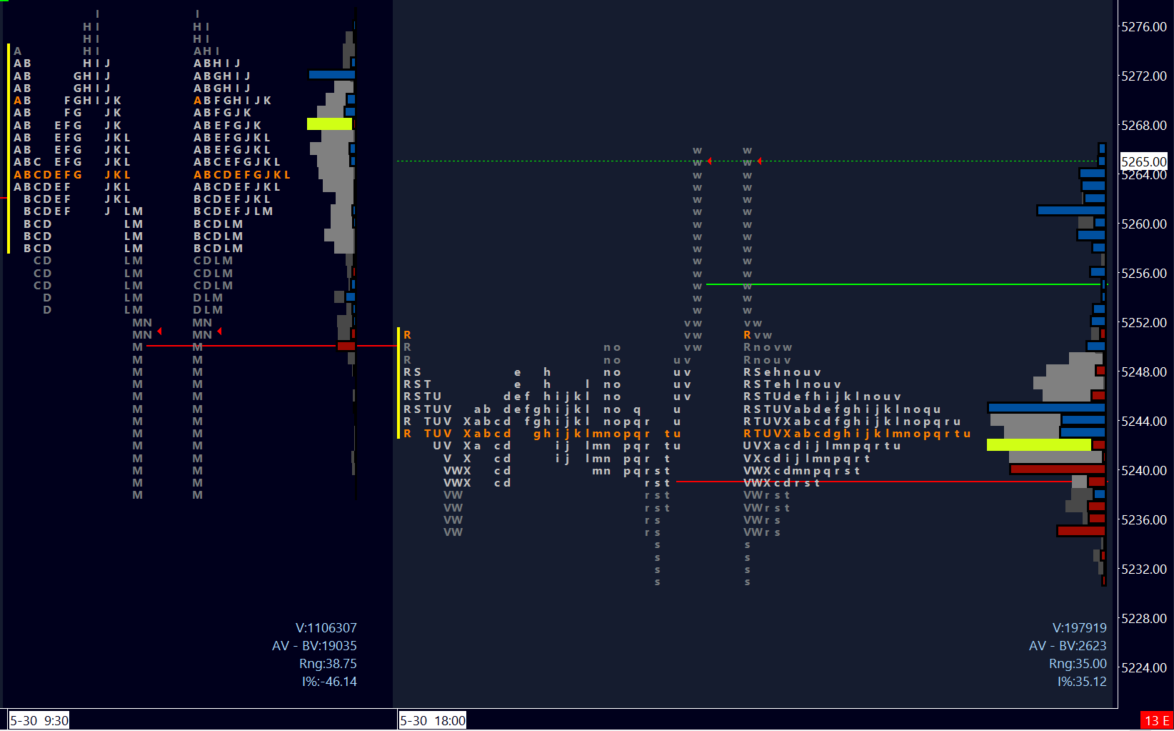
Looking back, the 5274 pivot (balance low) played an important role - twice. This was resistance at open by one tick, and later in the day by a few points. I stress the need for patience in this game - there will always be another opportunity. And if you find yourself getting consistently stopped out by a few points, would it not be better to next time target your entry price, but then perhaps two points beyond that?
Missing a trade is better than losing money.
If you enjoy my plans, admissions of guilt, and educational content, you can show your support (I might need it after Wednesday’s train wreck) by donating a ko-fi to the link/QR below! All my work remains free. However a token of support goes a long way to letting me know I’m helping your trading and understanding of a (now hopefully less) complex market. Comments, likes, retweets and sharing with your friends is greatly appreciated.
Minister’s Missal
Notes are as of 8h35EST. Thursday’s trade saw the winds shift in sellers’ favor, with full acceptance below prior (ten day!) balance. The weekly timeframe is in balance, with short-term daily OTFD. It is up to sellers now to maintain the short-term momentum into lower targets, with defense of 5275.
Before I move on, what do you notice about areas A and B in the image below?
Image 2. SPX daily bar chart
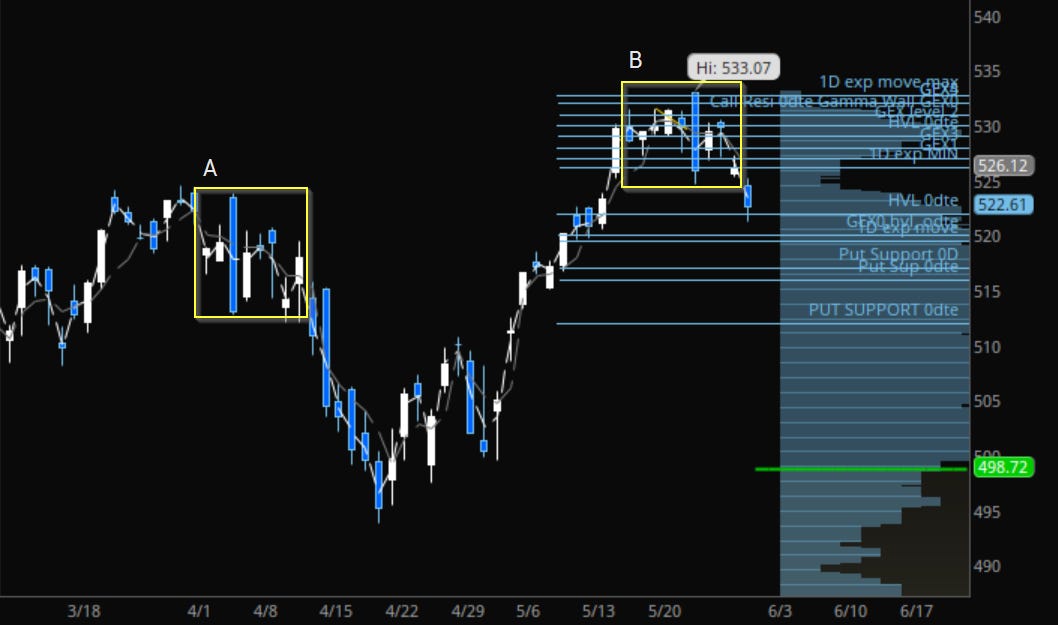
Comments here are drafted ahead of the PCE data release at 8h30EST. Levels of reference are unchanged however, with buyers looking to spend time above 5275 to reject the breakdown of structure, targeting closes above 5300. This would effectively negate bearish action.
Image 3. ES daily profiles
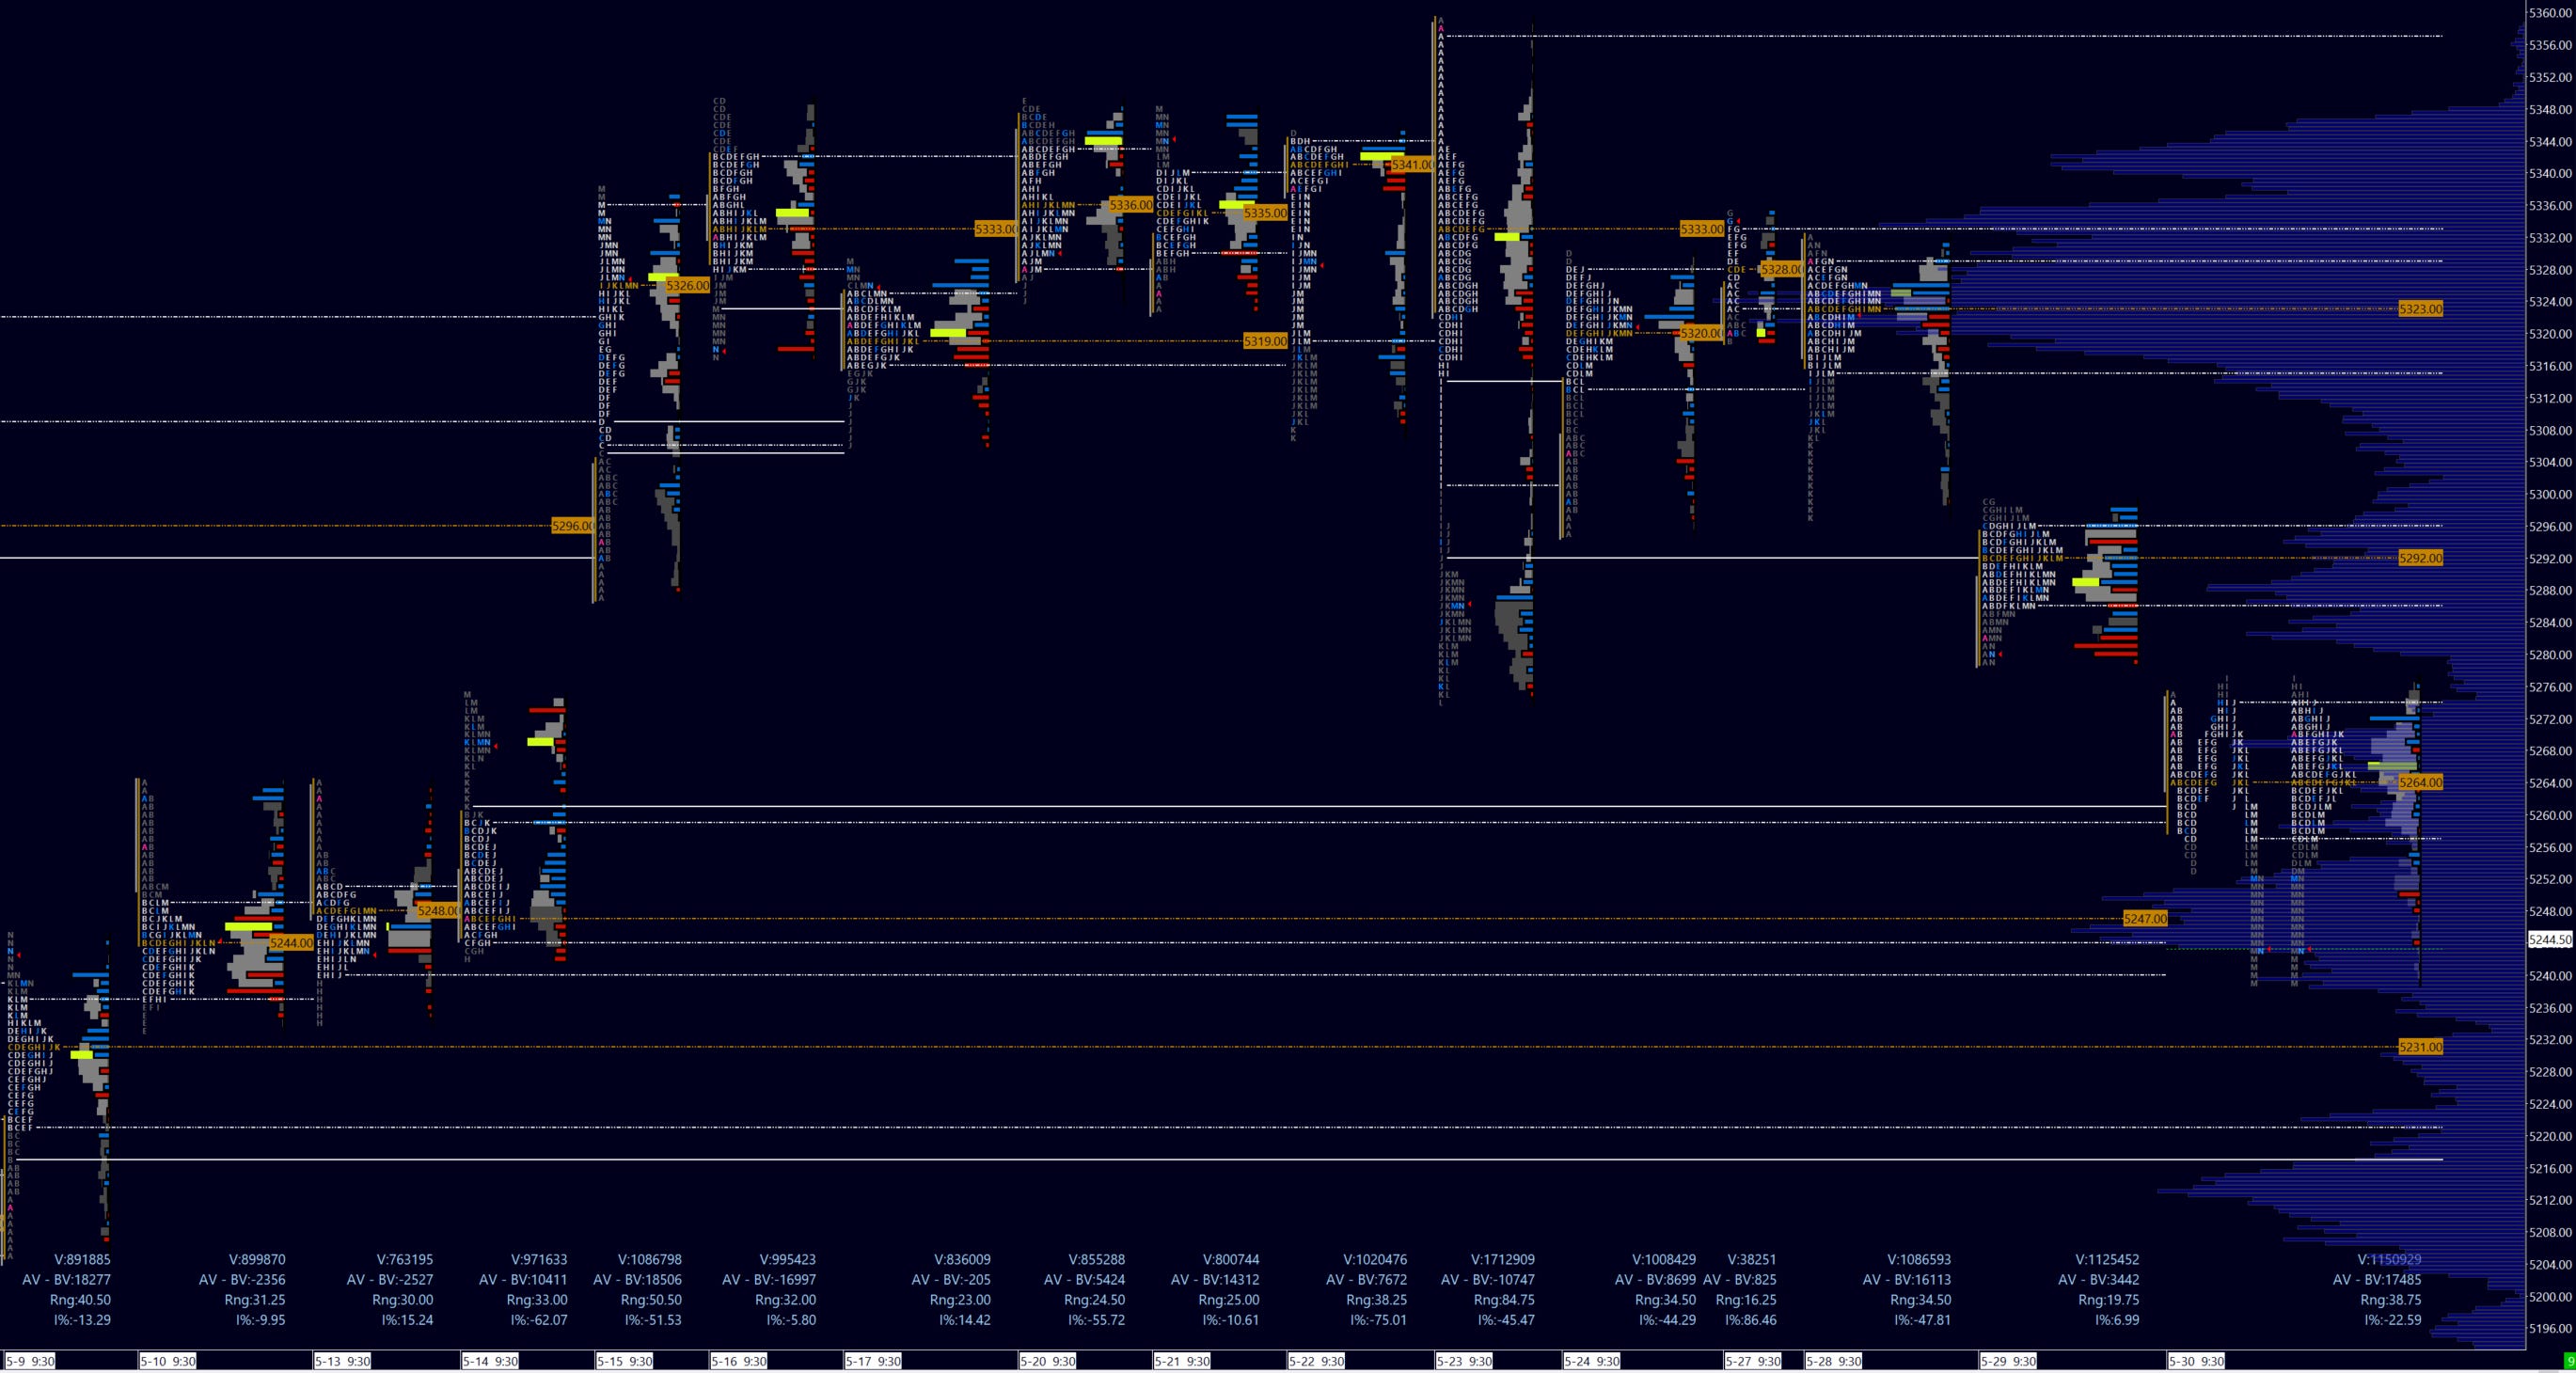
Sellers look to capitalize on this new momentum. This will be achieved with time below 5240, a prior daily high and the VAL of the mini-balance beginning May 10 which preceded the post-CPI gap. The main mission below is a repair of poor structure to 5216. This is a casual reminder that I am mostly a profile trader; levels are easier to identify and are generally quite precise. This is evidenced by a high R:R from my study of key structural levels in from the prior two months. Blue bars are the rate of incidence of trades returning greater than 4 R:R.
Image 4. Personal statistics on trades leaning on preselected structural levels
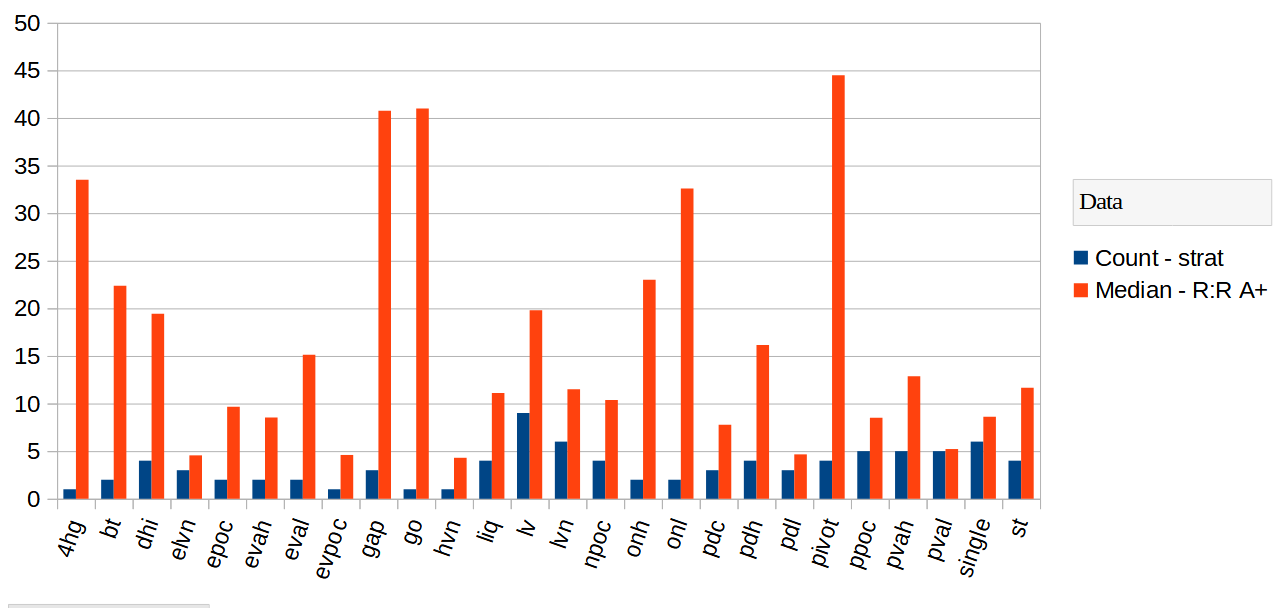
I strongly suggest you maintain a daily journal and statistical log to help you identify favorable trades. I will share the meaning of the labels above at a future time although most are easily identifiable!
Overnight inventory is mixed as of writing. I will consider daily pivot 5252 - Thursday’s break of balance and key psych level. Stay on the right side of the trade.
Friday Plan and Levels
Pivot 5252. Expecting range of 30 points with a possible 10 point extension.
a) Defense of pivot, time above 5262 20D SMA targets gap fill 5279. Further above is NPOC 5292 and potentially progress into key psych zone 5300-07 on strong momentum. Close above rejects bearish action.
b) Time below 5265 and consecutive closes below pivot targets a break of PDL 5240 on volume. That introduces possibility of trade into NPOC 5231 and structural repair to single 5216, where longer-term buyers are likely to be encountered. Any close below 5212 would solidify bearish momentum into next week.
c) VIX levels consistent - bears now want to see prints above 14.65 and buyers suppressing bearish action below 13.90. Proxy pivots for the indices may be found in AAPL at 190, and NVDA (which I think is leading the show) at 1125.
Image 5. 4H ES levels
Have I improved your trading? This journal remains free, but you can support my work by liking and commenting, sharing my work with friends or on Twitter - and certainly directly with a contribution. I appreciate your support: it keeps my publication ongoing and timely!
Tip jar

Be sure to follow me @rareverend on X (Twitter) for the latest updates.
Don’t maintain bias in the face of contradicting information! Capital preservation is key.
This is CERTAINLY not investment advice and I am not a qualified licensed investment advisor nor a minister of the church. All information found here, including any opinions, commentaries, jokes, outright mistakes, and suggestions - expressed or implied herein - are for informational, entertainment or educational purposes only and should not be construed as personal investment advice. While the information provided is believed to be as accurate a picture of trade as I see it, it is after all how I see it and errors or inaccuracies are practically expected. I will not and cannot be held liable for any actions you take as a result of anything you read here. As always, conduct your own due diligence, or consult a licensed financial advisor or broker before making any and all investment decisions. Any investments, trades, speculations, or decisions made on the basis of any information found on this site, expressed or implied herein, are committed at your own risk, financial or otherwise.
Sold puts at 5217. Your 5216 was golden....didn't think it would make it there but it sure did. I needed that. Thanks so much. I didn't pivot and buy down there...but shorted again at the very end of the day. We shall see....