
Jan 24, ES Plan and Missal: Sprint the Marathon
4900 is sweetest
Image 1. Just join ‘em already. Woman in the Dunes (1964)
One of my favorite films of all time - both thematically and visually - Teshigahara’s Woman in the Dunes sees its etymologist protagonist finally give in to the sand trap he is ‘invited’ into by very strange, conspiring villagers. I won’t give out the whole plot, but the eternally caving-in sand in the context of his eerie new companion suggests the predicament of sellers for some time now. Following a one week break of OTFU, we are once again back to making new highs - within six ticks of 4900 at settlement.
While refraining from calling tops, remember that when the bears finally give in we may be approaching one. Always wait for confirmation however!
Minister’s Missal
I had a short bias coming into the session given in the prior day write-up. This did play out at the open despite a fresh ETH high ahead of the bell. However it was a painfully slow drip through the ONL, and just three ticks above the PDL. The weak low then carved here in D and E periods was a great location to lean against. Not only because the stop was extremely tight against the prior day, but it was also my day’s pivot! You can’t ask for better.
Yesterday’s ‘b’ shape profile also suggested absorption and that a resolution of Monday’s poor high were a possibility. So why was I short bias into the open? That was simply due to flows at the PDC (and into settlement), as well as what I thought was an elevated likelihood of sellers making a second attempt in today’s session. This is also why the PDL was a great reference for the day.
Image 2. ES Monday RTH and Tuesday ETH, RTH profiles
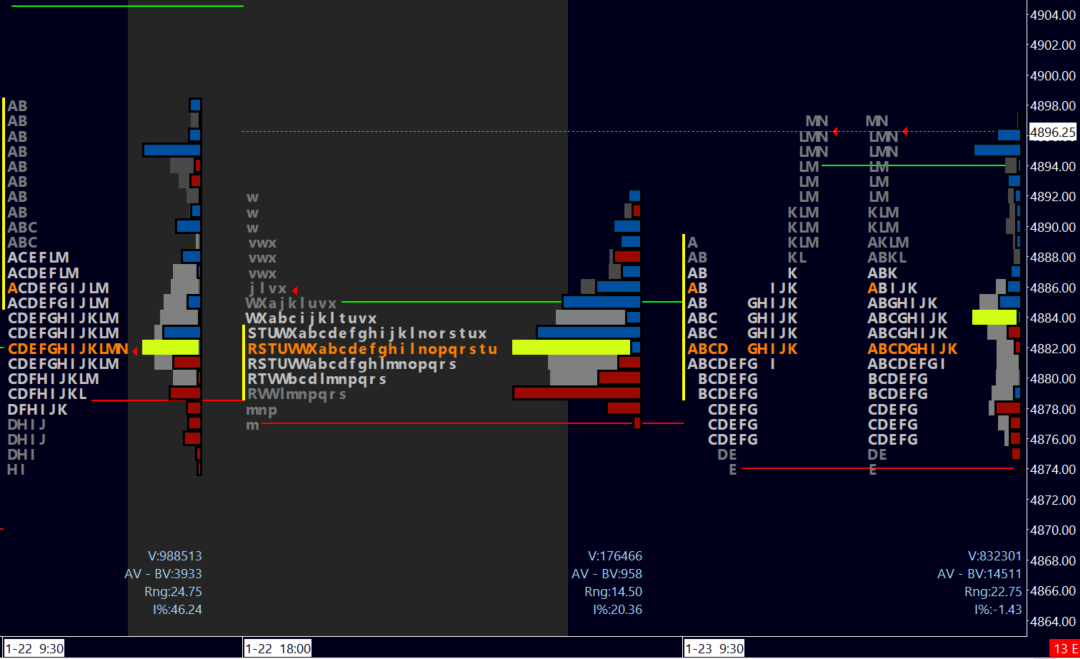
It is important to review Tuesday’s low since this is a superb lesson in identifying the signs of potential reversals on the footprint / tape. Aside from structural clues (test and hold PDL, developing ‘b’ shape profile), a more granular look reviews weak sellers, strong passive buying leading to seller exhaustion (delta flip), and finally buyer initiation. Note the last red delta bar in the graphic below, that is the final selling attempt that is completely absorbed, making a higher low.
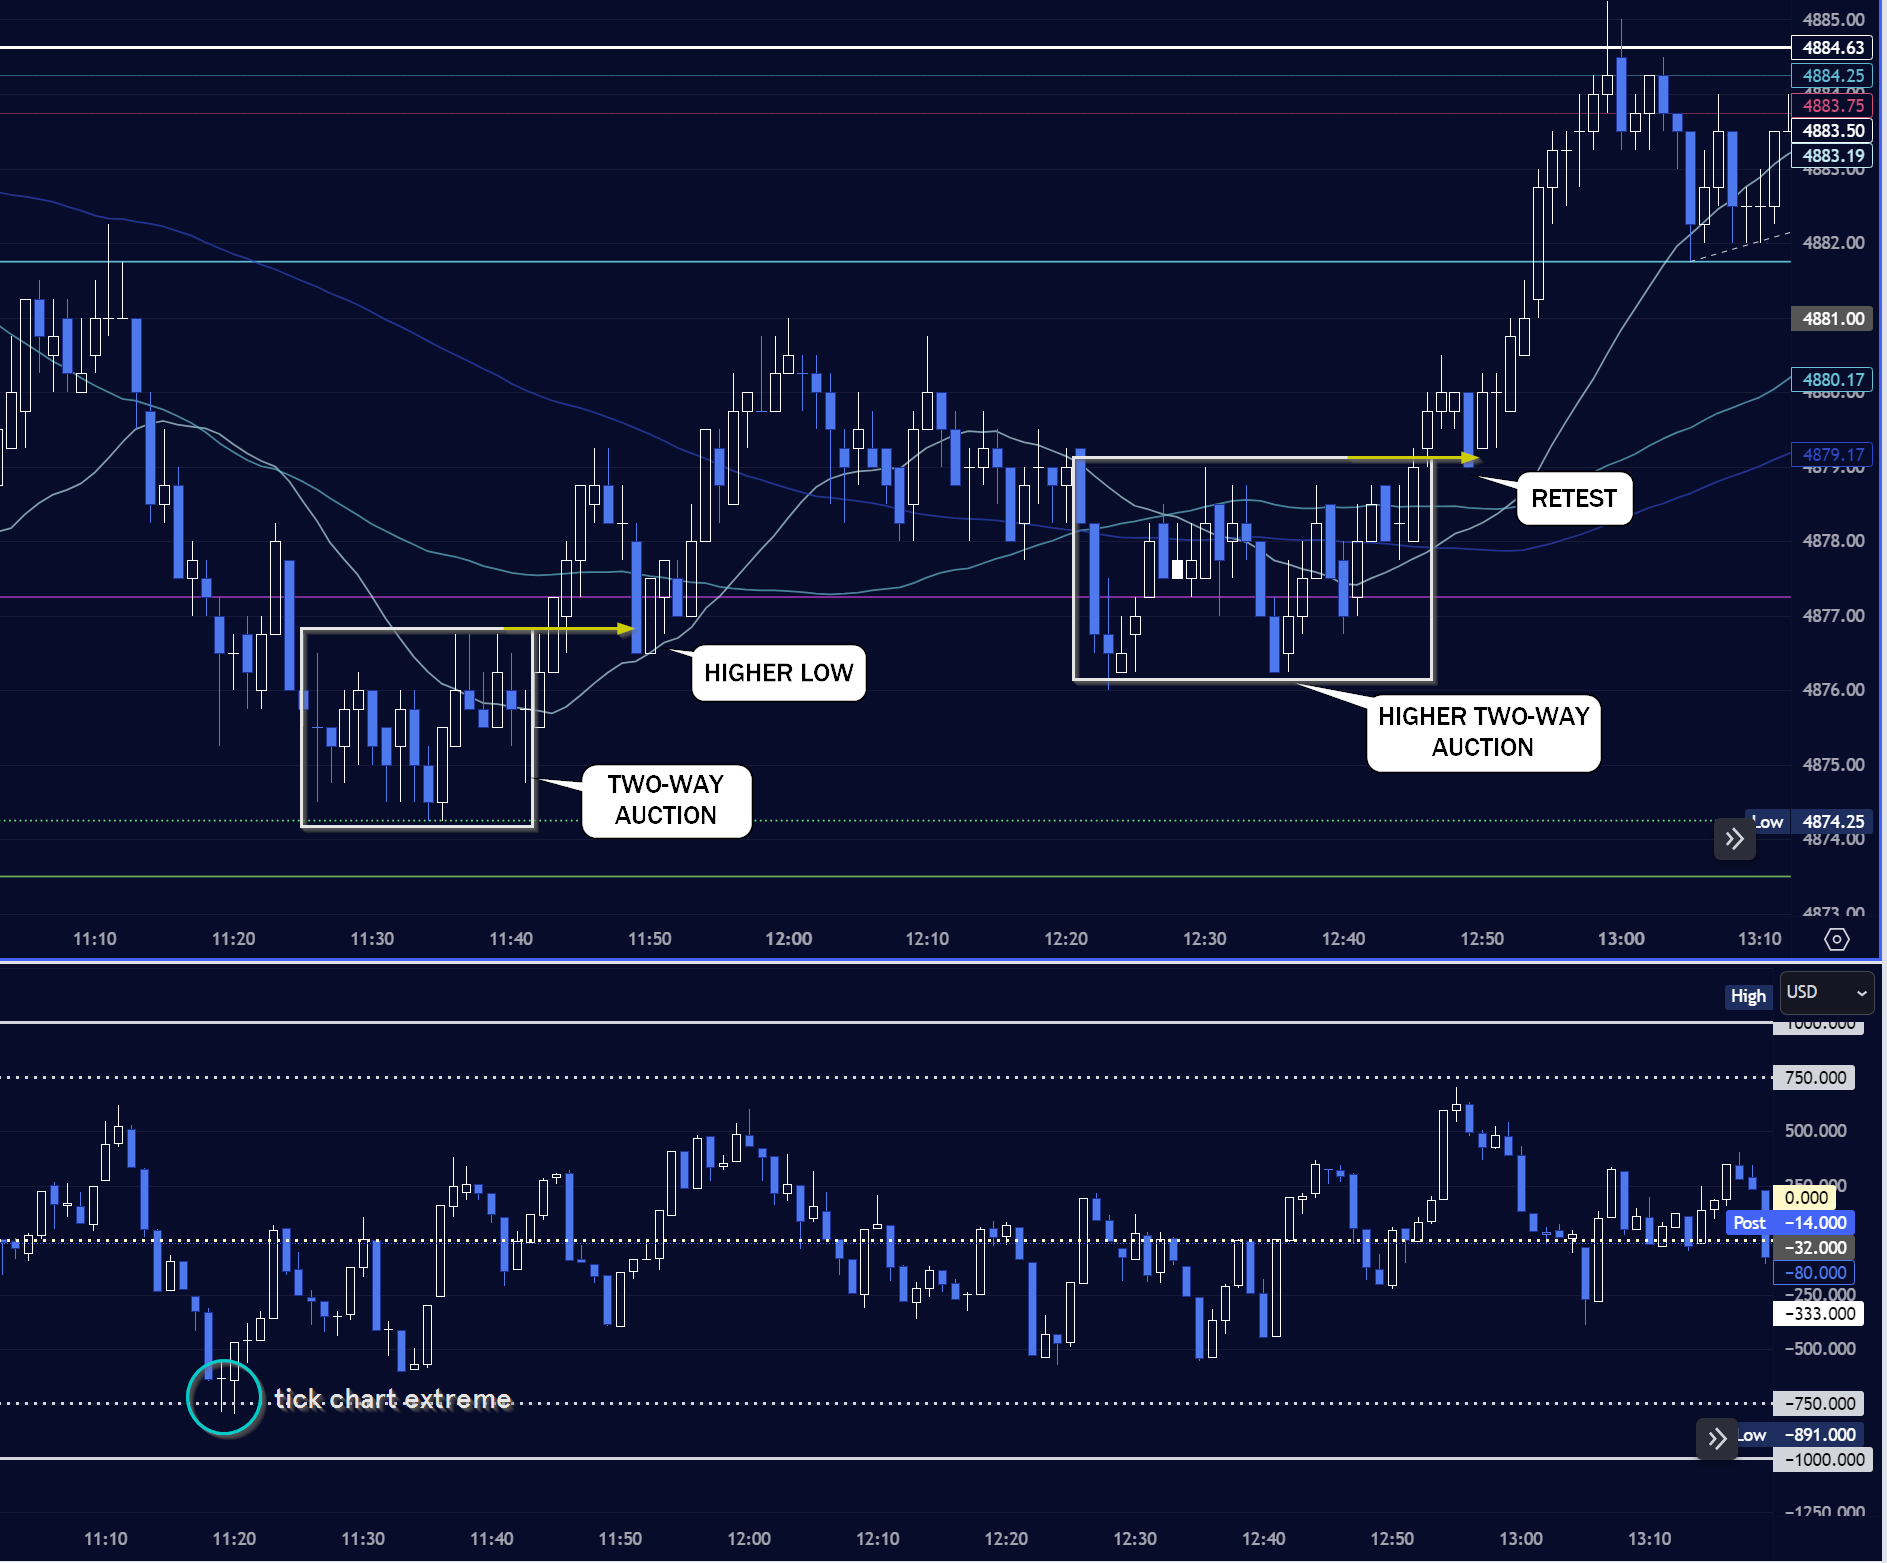
Image 3a. Order flow at the poor low

With regards to candle charts, the retest of a prior area of auction is your confirmation (and best friend). There are different tools to interpret the data but the conclusions should be the same - where is absorption taking place? What are the signs of exhaustion? Finally, and perhaps most importantly - where is an ideal stop location?
Image 3b. 1M Candle chart of the low and subsequent higher low
Crucially, short-term (five day) value has jumped 90 points from 4792 to 4882! This is a huge success for longs, and is now a key level of support as we test prices above 4900. Settlement itself was just under 4900.
Tuesday suggested absorption in another ‘b’ shape profile (Image 2). With overlapping value areas we now have two days of balance. While this may not be sufficient for a major breakout/down ahead of PCE on Friday, it can certainly open up levels on either side, especially to the upside in the absence of sellers.
For tomorrow I will be watching closely the 4888 level as a pivot. This proved to be a key resistance, balance VAH, and LVN. I lean to a test of some key levels above, before a return to balance.
Wednesday Plan and Levels
Pivot 4888. Despite the exceptionally low volume Tuesday, sellers were not able to initiate, seemingly holding out for higher prices above. With PCE on Friday neither side may want to take a decisive step, although the trend is your friend so until conditions change our bias is up. Note PMI at 9h45EST.
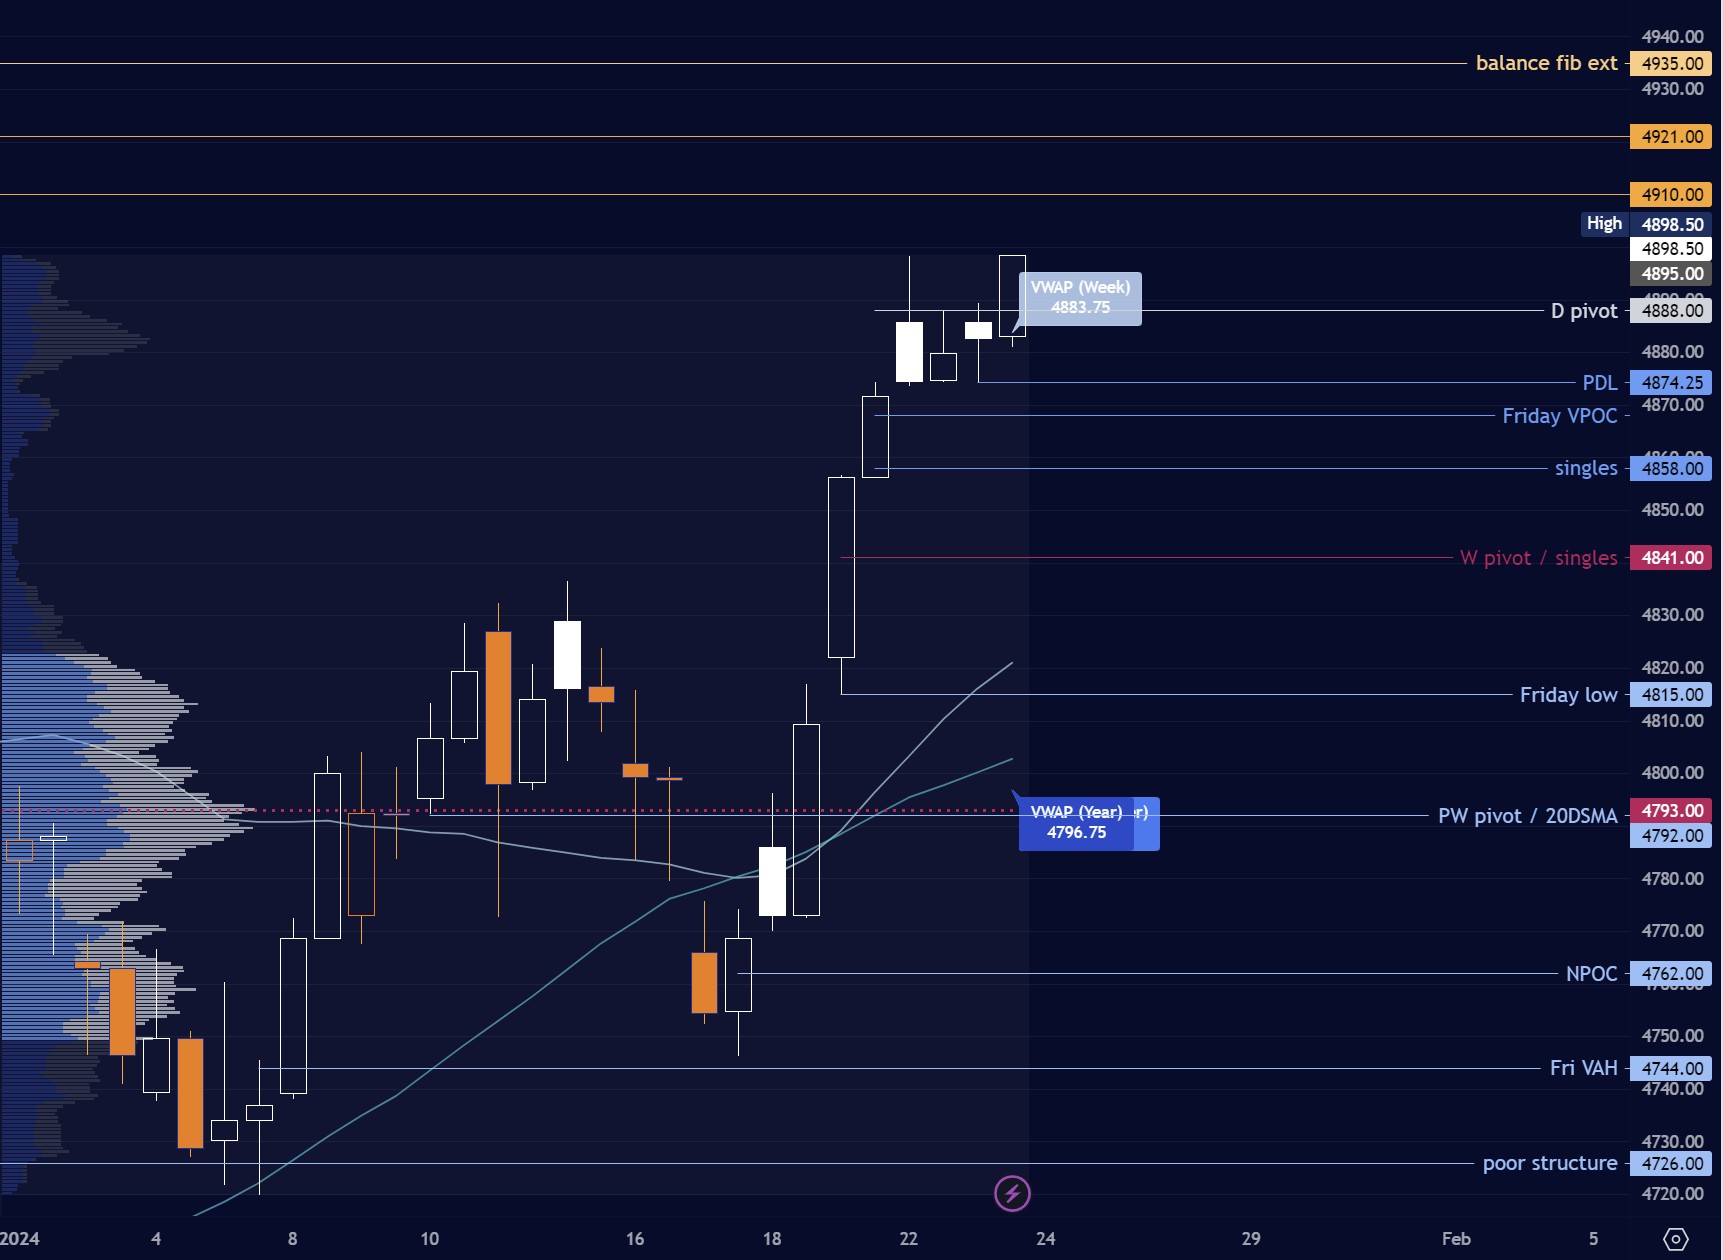
a) Buyers maintaining above 4890 and breaking 4904 can target 4910 and 4921, areas which may encounter selling. If volume increases substantially, there is a chance for overshoot into 4927 and 4935 further above.
b) Sellers keeping a lid on 4910 will aim for time below pivot. This can negate prices above 4900, and their focus will be a retest of balance VAL 4878 and a break of PDL to Friday 4868 VPOC. Further below are singles to 4858.
c) Buyers can remain supported with VIX below 12.80, as well as AAPL above 195 (which sets up a test of 200 by the way). Perhaps an interesting proxy is NFLX, with support at 520 potentially translating into ES prices above 4900. Finally, TSLA with an hourly close over 212 can aim for time over 216.50, which can set up a retest of 220.50.
Image 4. 4H TF, Critical ES levels
Tip jar - support my continued work!

Your support and comments are appreciated. I do my best to respond to everyone in a timely way. Be sure to follow me @reverend on X (Twitter) for the latest updates!
Don’t maintain bias in the face of contradicting information! Capital preservation is key.
This is not investment advice and I am not a qualified licensed investment advisor. All information found here, including any opinions, commentaries, and suggestions, expressed or implied herein, are for informational, entertainment or educational purposes only and should not be construed as personal investment advice. While the information provided is believed to be accurate, it may include errors or inaccuracies. I will not and cannot be held liable for any actions you take as a result of anything you read here. As always, conduct your own due diligence, or consult a licensed financial advisor or broker before making any and all investment decisions. Any investments, trades, speculations, or decisions made on the basis of any information found on this site, expressed or implied herein, are committed at your own risk, financial or otherwise.