
From Thesis to Trade V: All In
Instant Synthesis

This series will serve to integrate trading tools and methodologies in a faster-paced visual format. My trading is fundamentally grounded in the market profile, and that is where we start each of these lessons.
Image 1. Risk it! W. Dieterle, Dark City (1950)
In the Crowstack we love ‘look above and fails’. Nearly as must as retests of anchored VWAP retests! Occasionally a confluence of setups presents itself - this is the ideal time to scale up to full size.
Not when catching Dogecoin bottoms. Sorry, Musk bros.
So put your chips on the table when a clear profile setup lines up with your thesis, using tools that allow you to gauge the exact entry and stop location for your trades. This is just one amazing example below.
Leveraging the Market Profile
Recall the study guide from CBOT. No sign-up necessary.
Image 2. ES profiles. Profiles in review, Dec 11-12
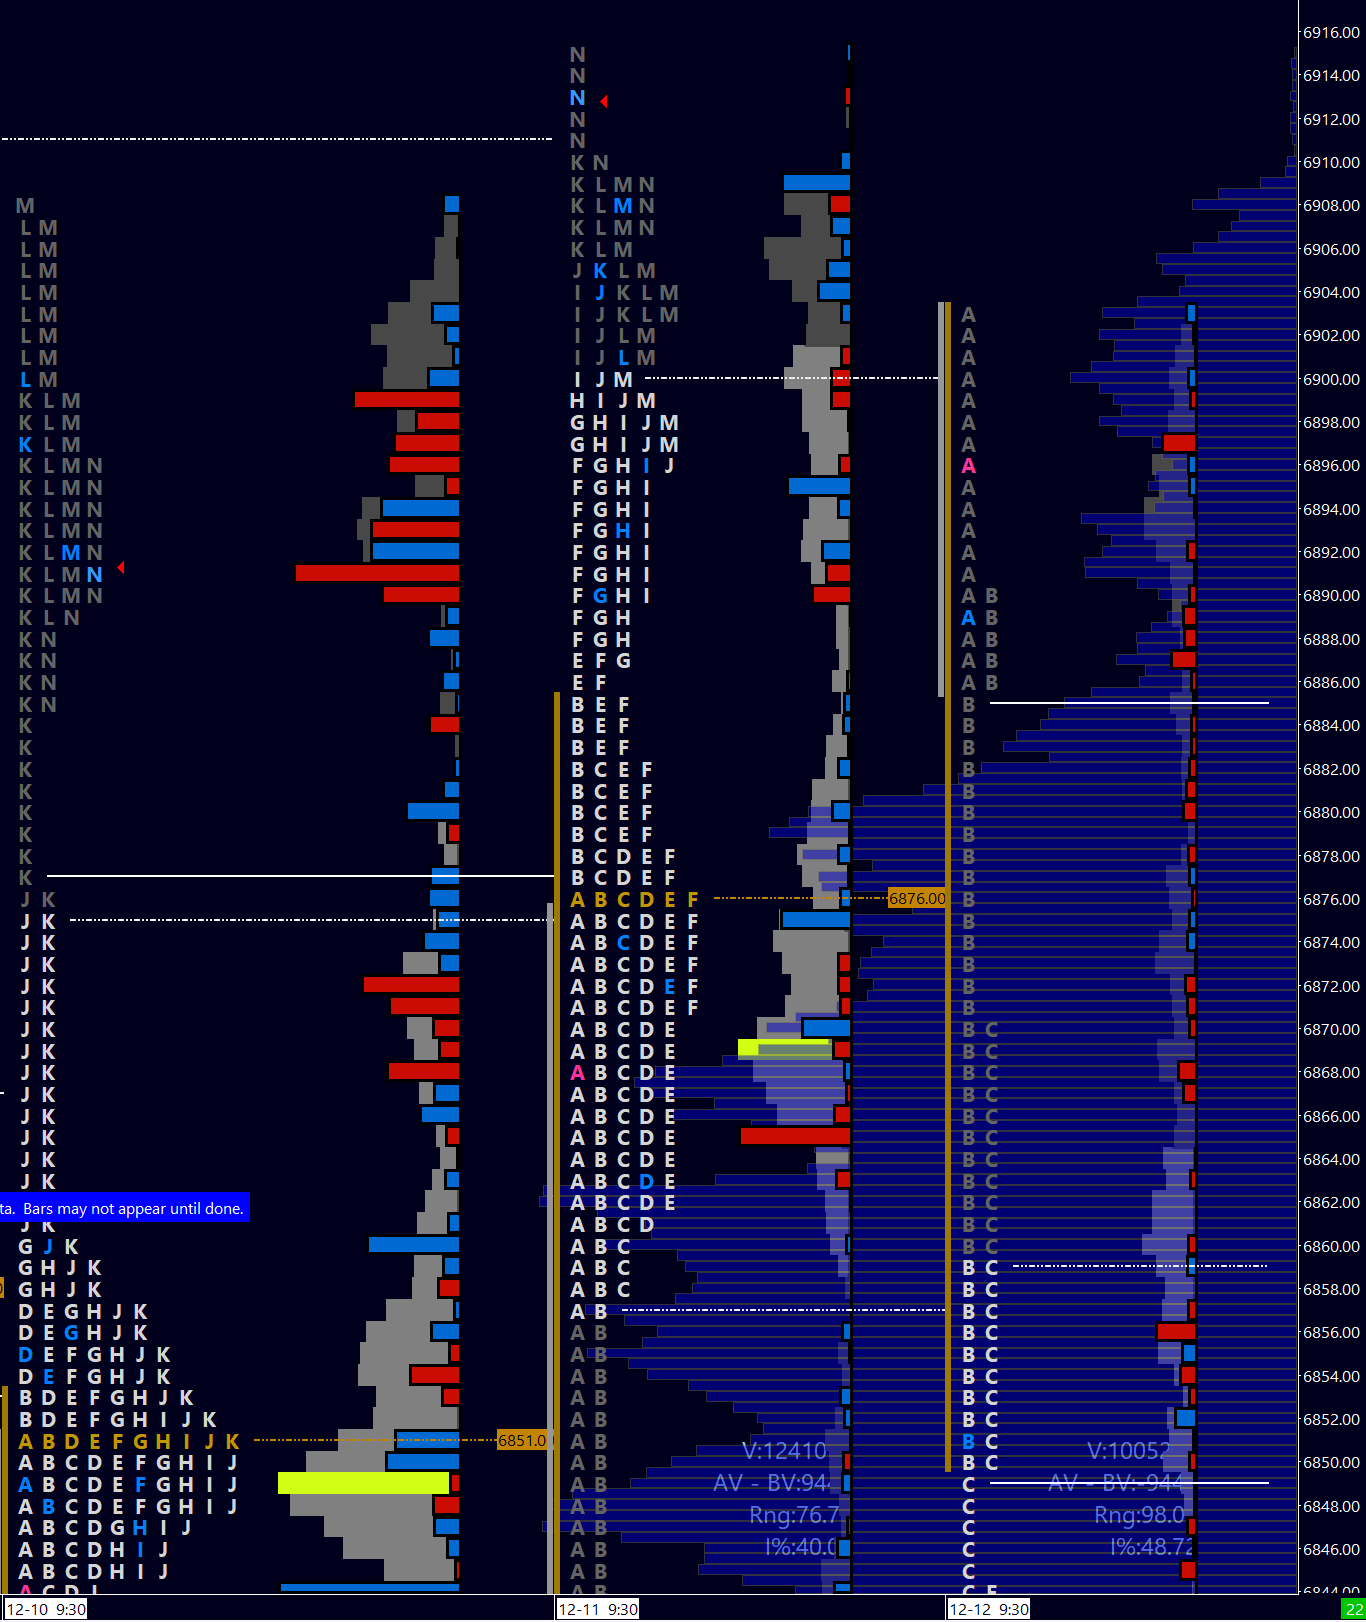
After FOMC on Wednesday, we were looking for a potential break of balance in either direction (but generally up as the current liquidity-driven market favors those odds).
With continuation hoped for by either the breakout / breakdown team.
That means keeping in mind that a ‘look above’ or ‘look below’ and fail is always on the table for the next major market move. As would be fitting for my thesis - laid out in the FOMC piece above - that the real move would probably happen the following week, once sufficient retail was trapped.
Let’s look below to this past Friday’s action. We already saw some post-FOMC weakness in the overnight session, as seen here:
Image 3. ES 30m chart
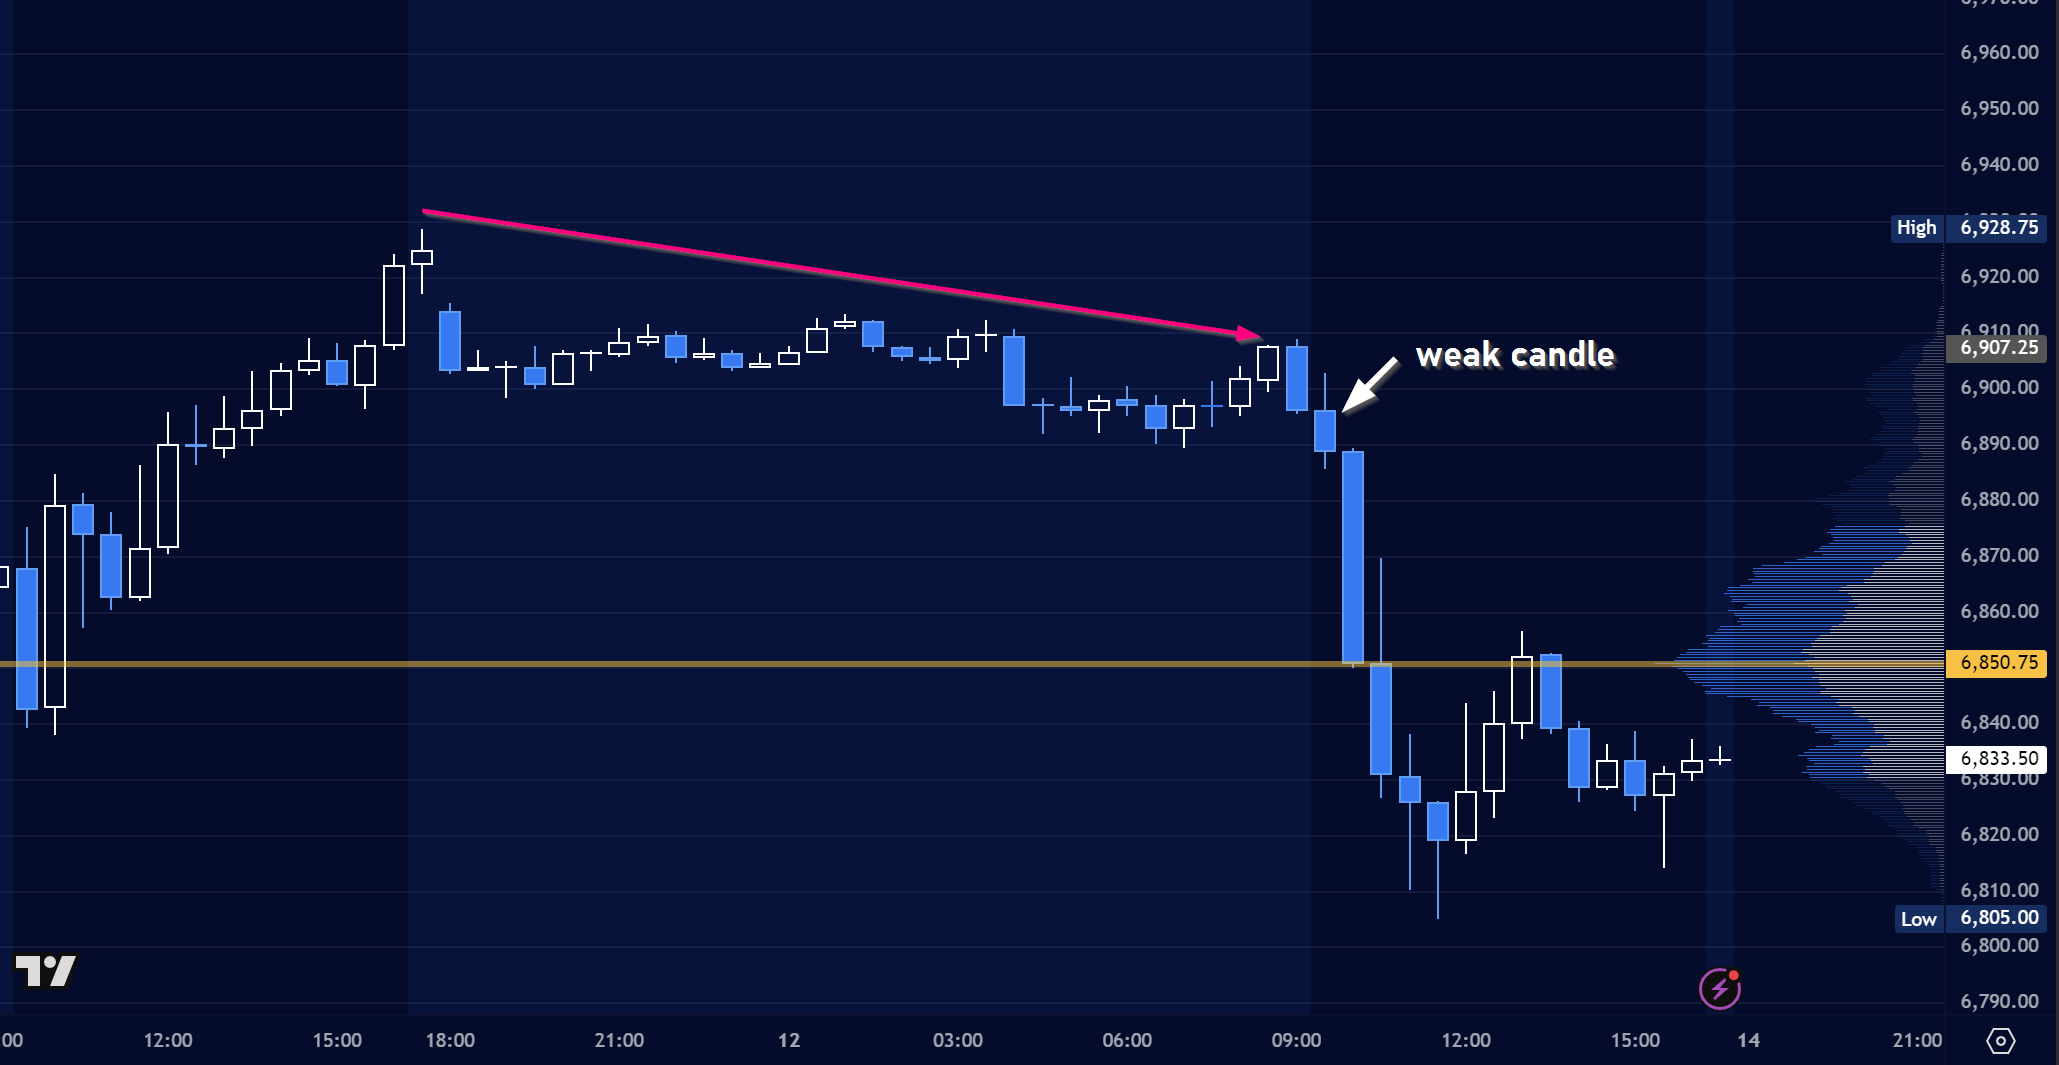
Sellers already active before the bell (note the lower highs). It is then on them to see follow-through. I generally prefer to sit out the A period in the Trump 2.0 market unless a clear setup presents itself - for example, a look above and fail in the immediate opening action.
The Trade. Friday, December 12
Now we mark up the profile chart with key information and levels to watch. As always, we look to the prior day’s value area and POC, noting the PDVAH at 6900. Nice even number!
(Don’t forget to also note the weak PDH, then then LVN in profile. OK, that should be enough for levels near the open.)
Image 4. ES profiles
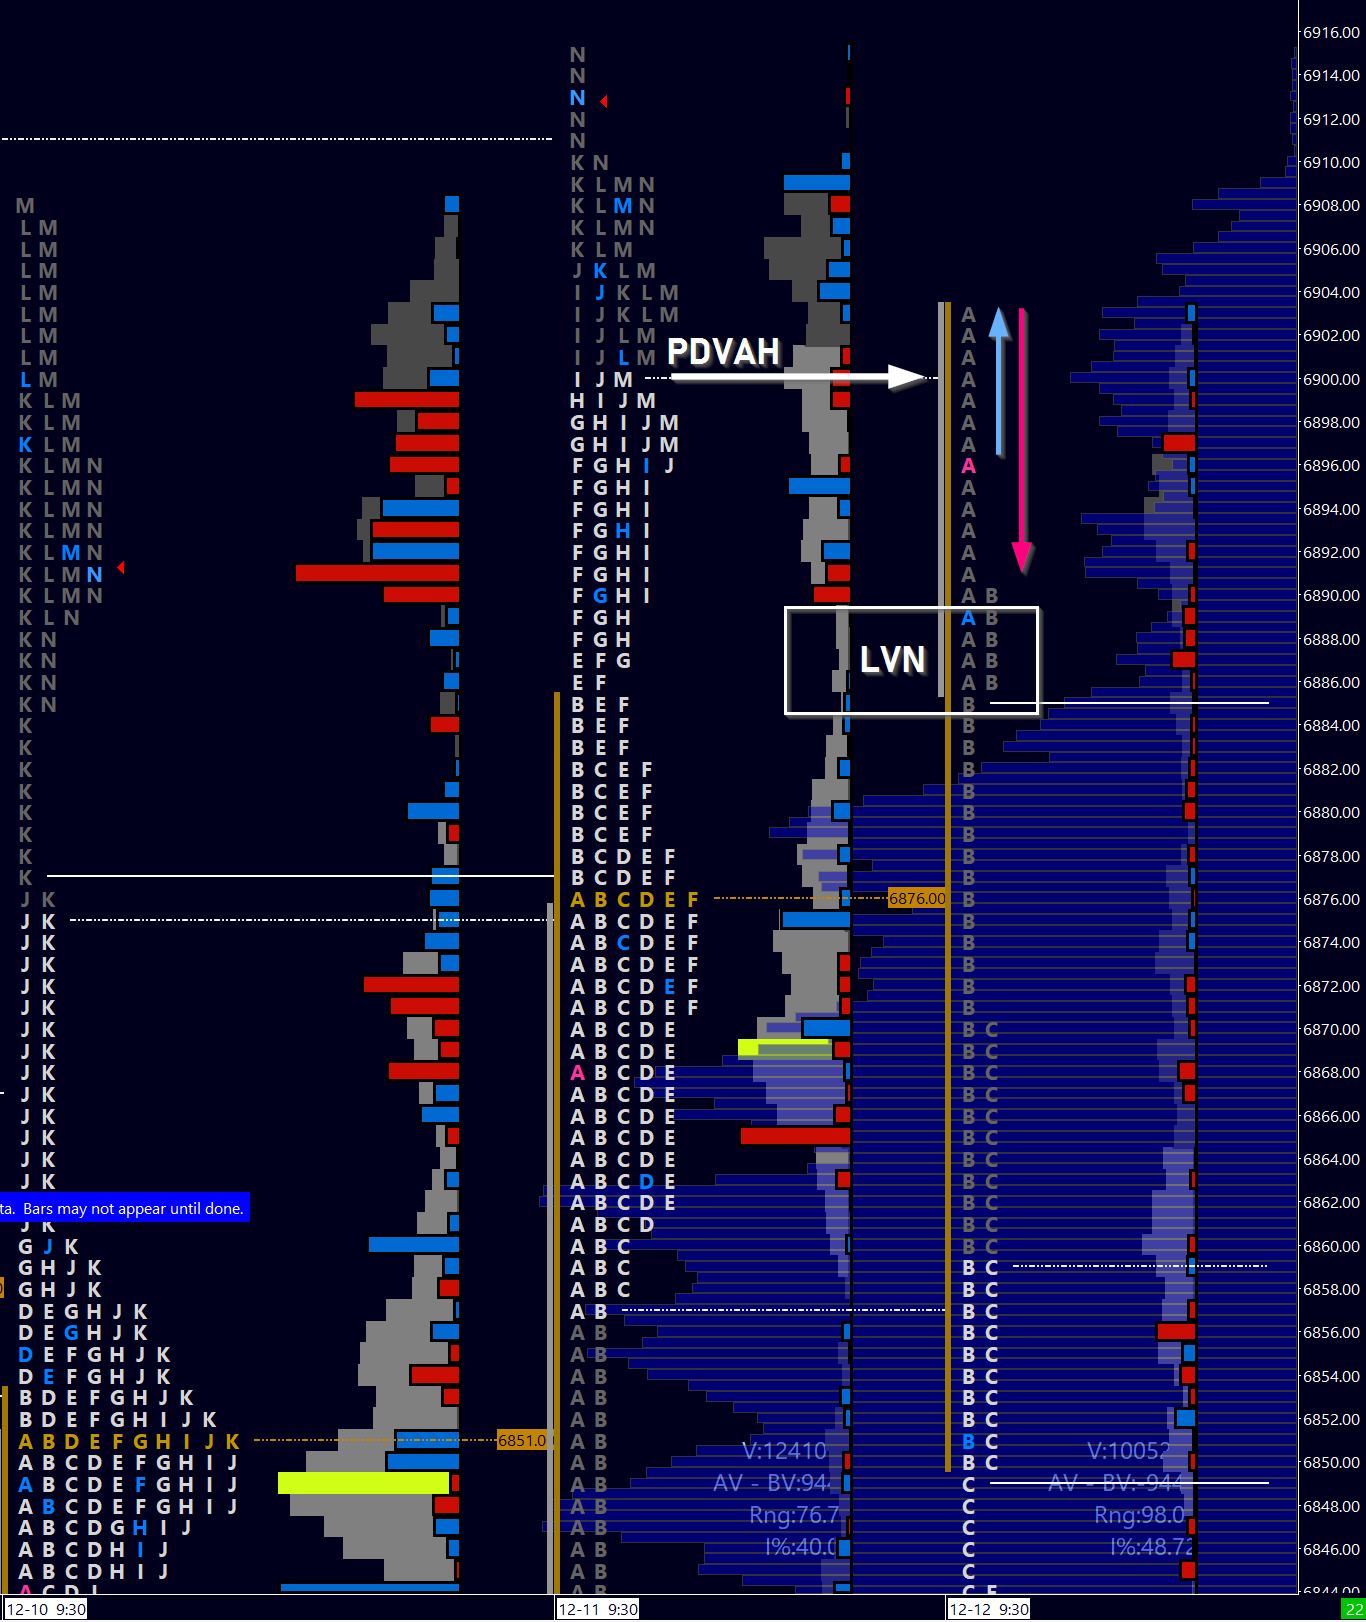
That PDVAH / 6900 is great for confluence and thus a doubly important reference point, further strengthening the short side as post-FOMC euphoria bails below a key psych number.
The A period puts in a weak candle, closing near its low after an attempt to regain some ground at the open. That’s already a look above and fail of the prior day value area!
A short thesis is very much in play at this point. Let’s look at how we can masterfully execute this setup.
First let’s look at some broad clues from the footprint, then we’ll mark up the chart.
Image 5. ES 5m footprint
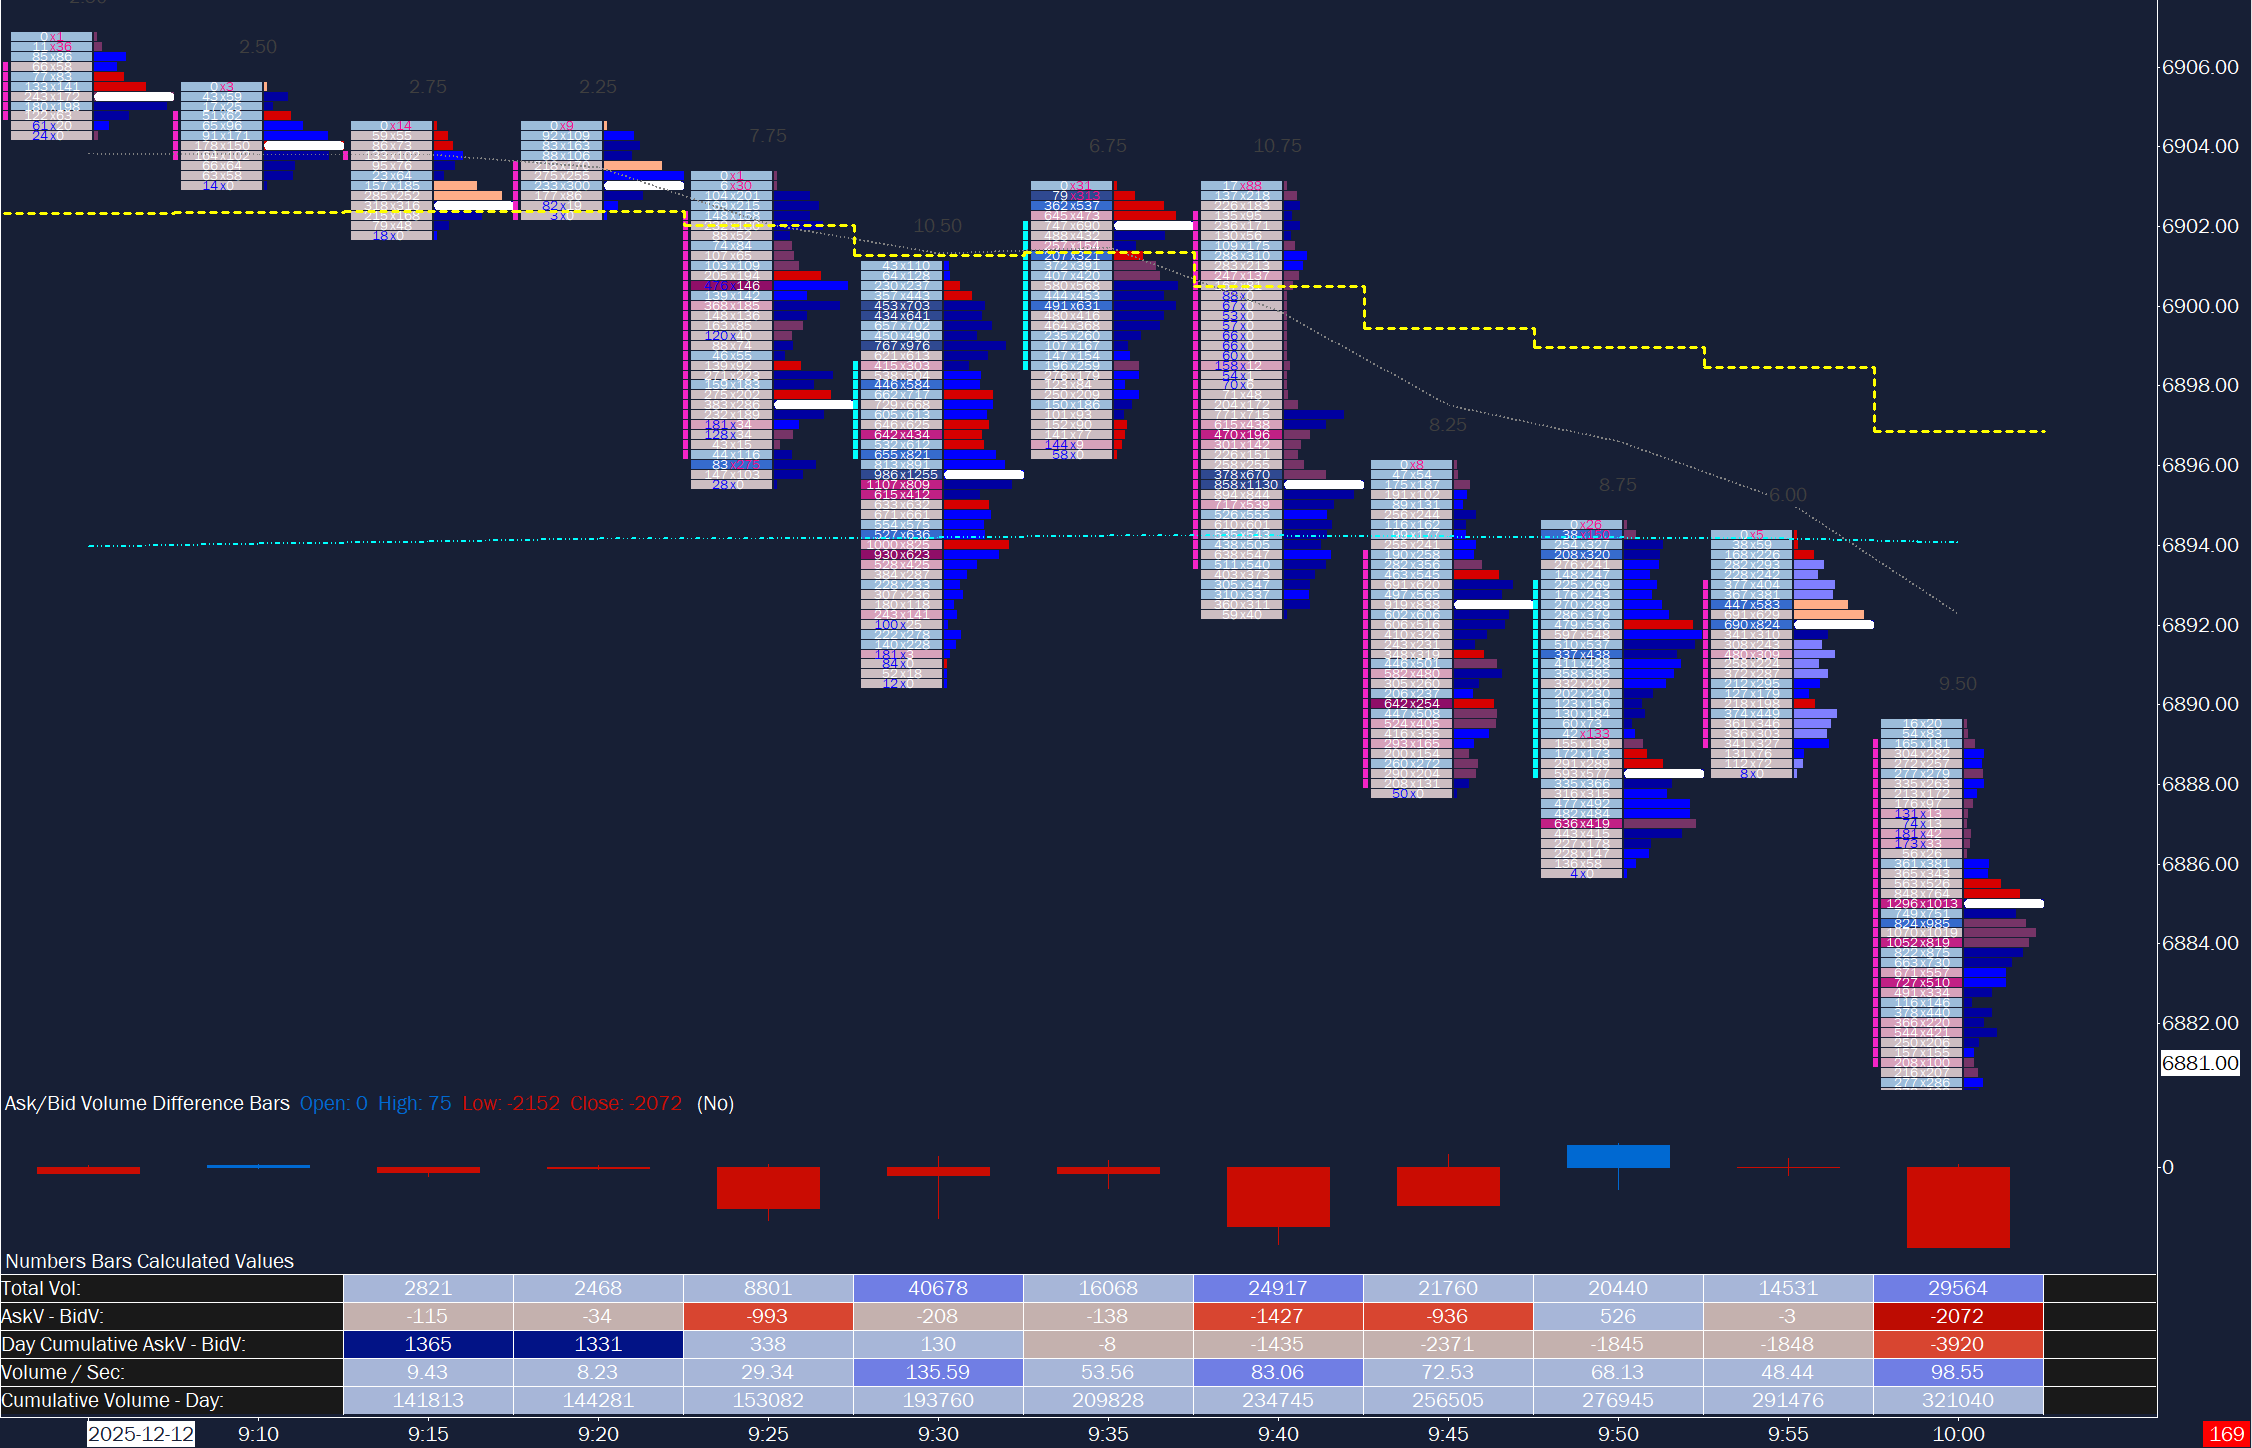
What I see: