
From Thesis to Trade Special: Santa Rally
A Profile Christmas Story

The profile is a powerful tool all-around. In this Christmas lesson, I’ll take a look at simple profile cues to determine whether Santa was planning on bringing gifts on a year-end rally.
Image 1. Learn to be a good trader
The profile really reveals all. We don’t need level 4 data, dark pools, or options flows to tell the story. The profile, screen time, and intuition is often all you need to know which way the wind is blowing.
Leveraging the Market Profile
Recall the study guide from CBOT. No sign-up necessary.
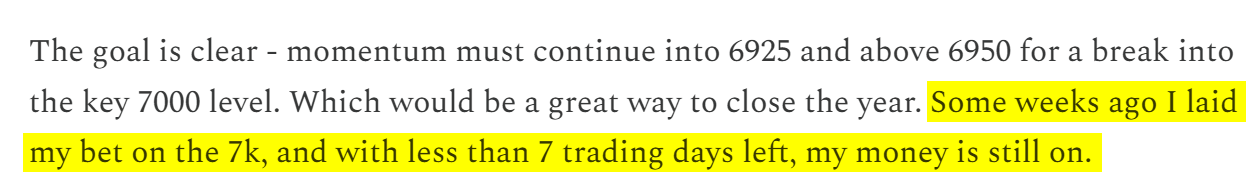
Image 2. ES profiles, December 15-19.
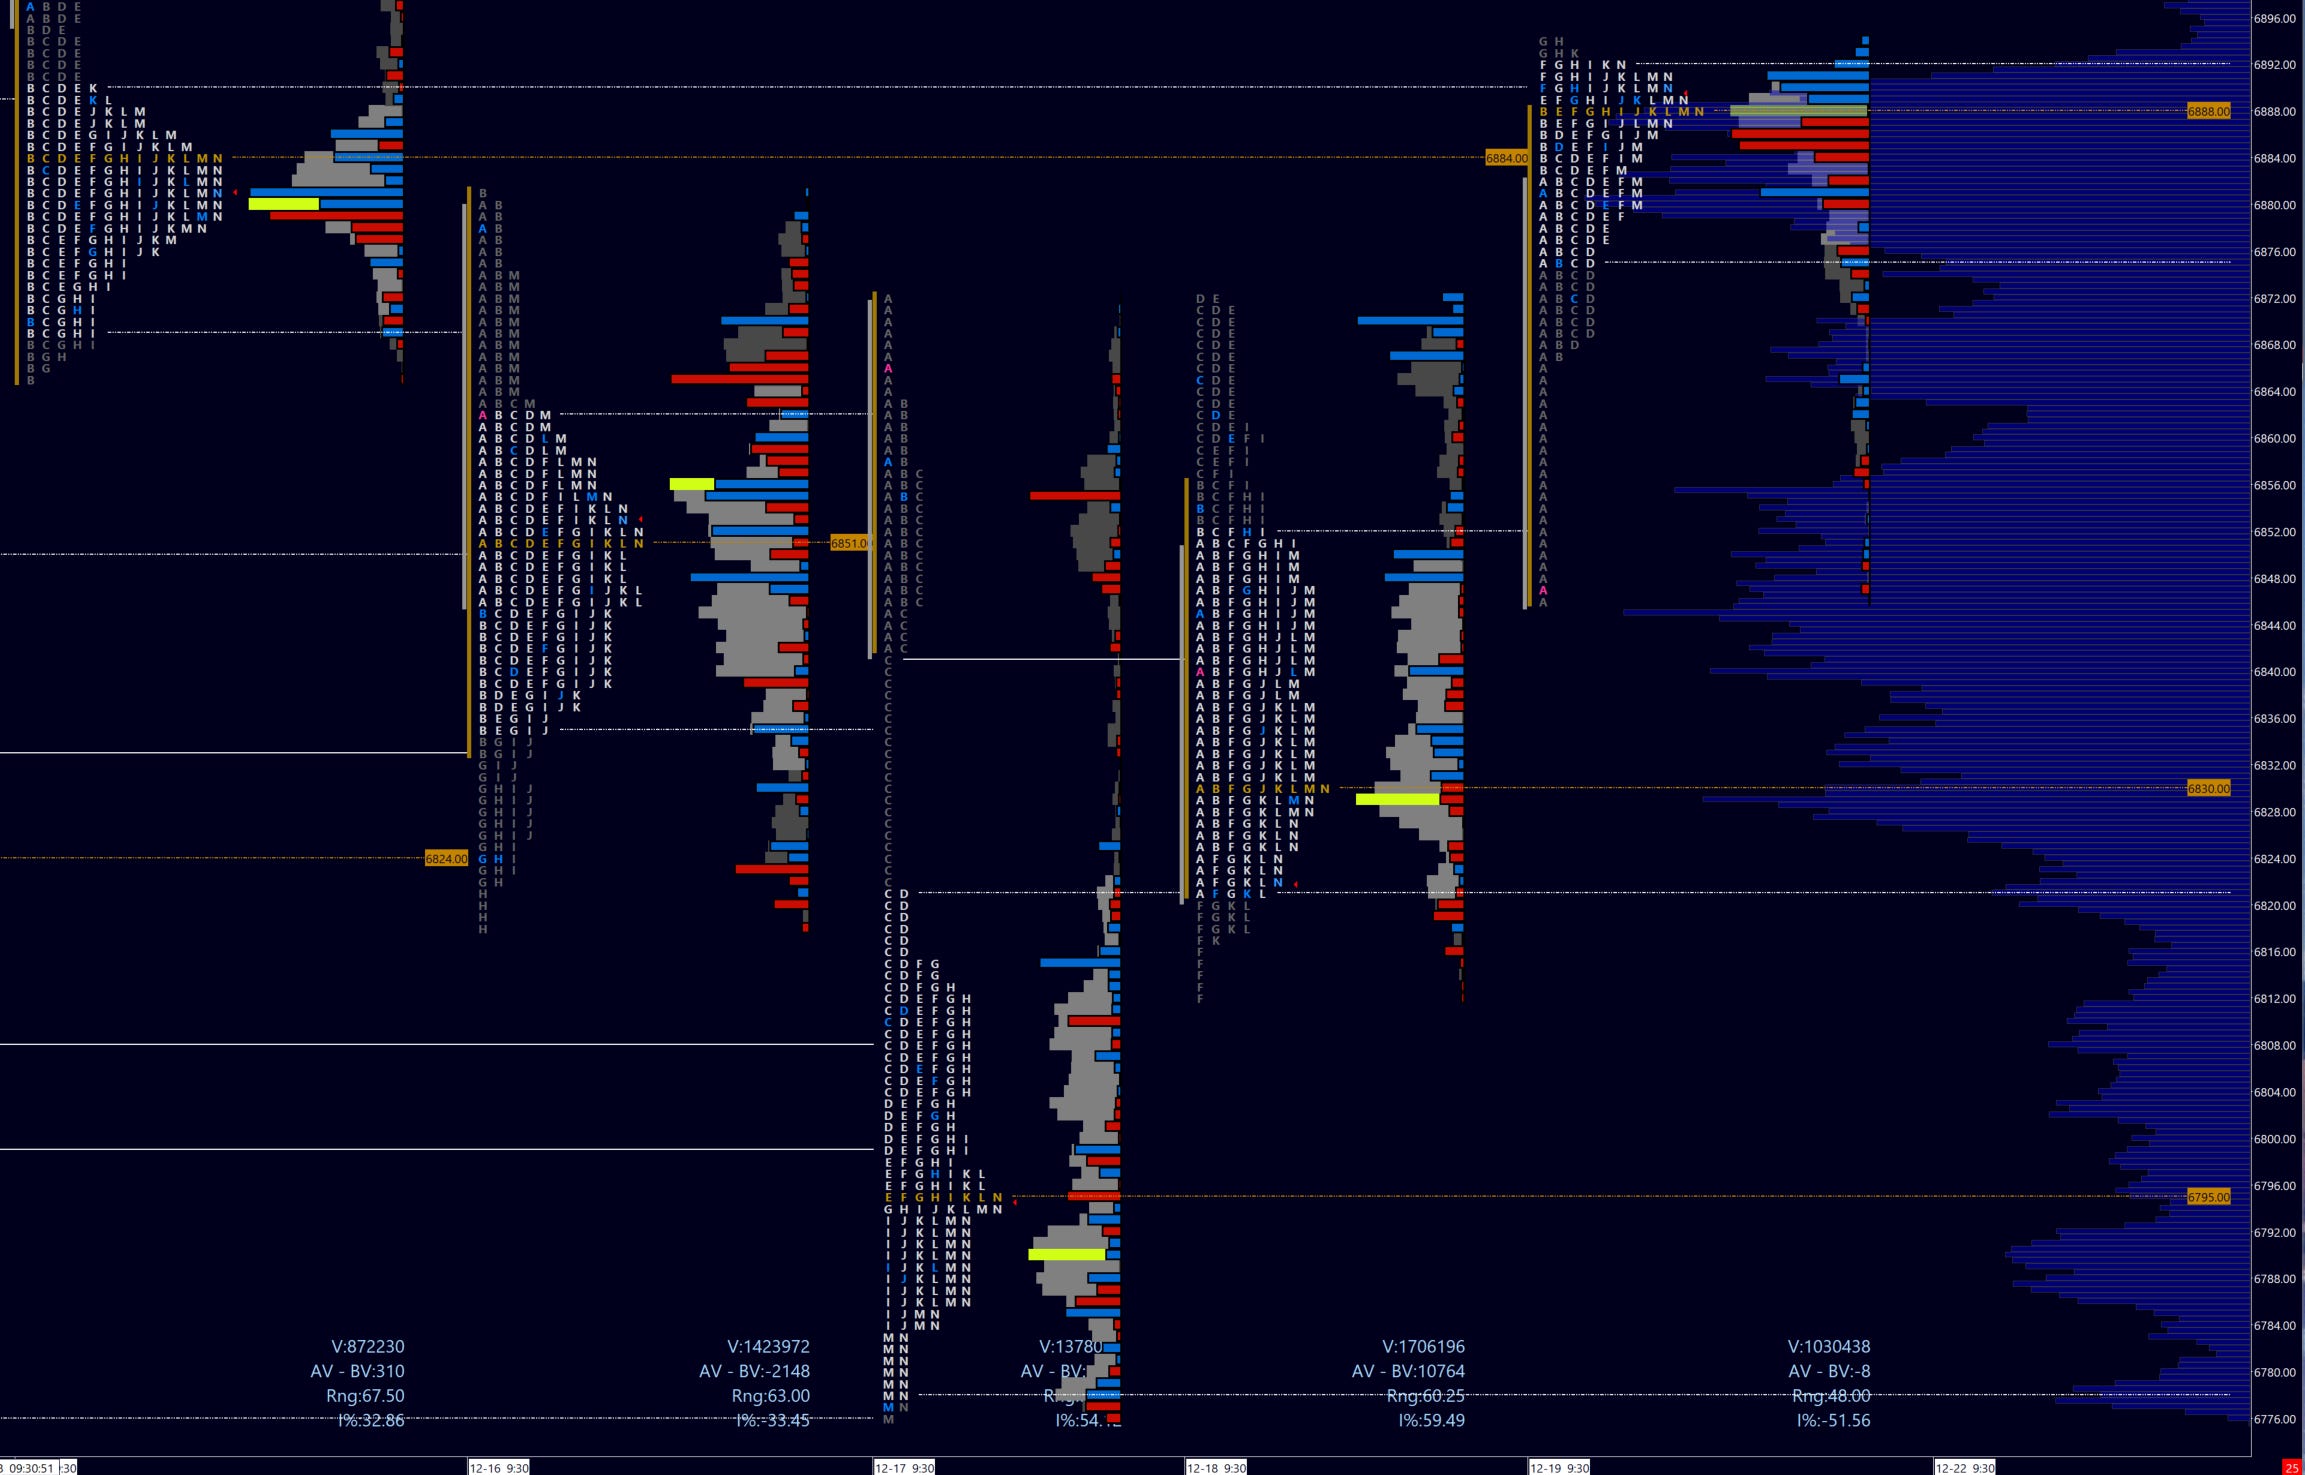
Take a look to the profiles above. Beginning on the 15th, we have two profile that accept value lower. You can note the even distribution of prices as the POC shifts down on two successive days (Monday the 14th saw the POC at 6913).
Wednesday, December 17th shows two camps separated by C single prints. Ultimately the bear camp won out as we closed in the lower distribution, right at the POC and slightly above VPOC.
Image 3. ES profiles
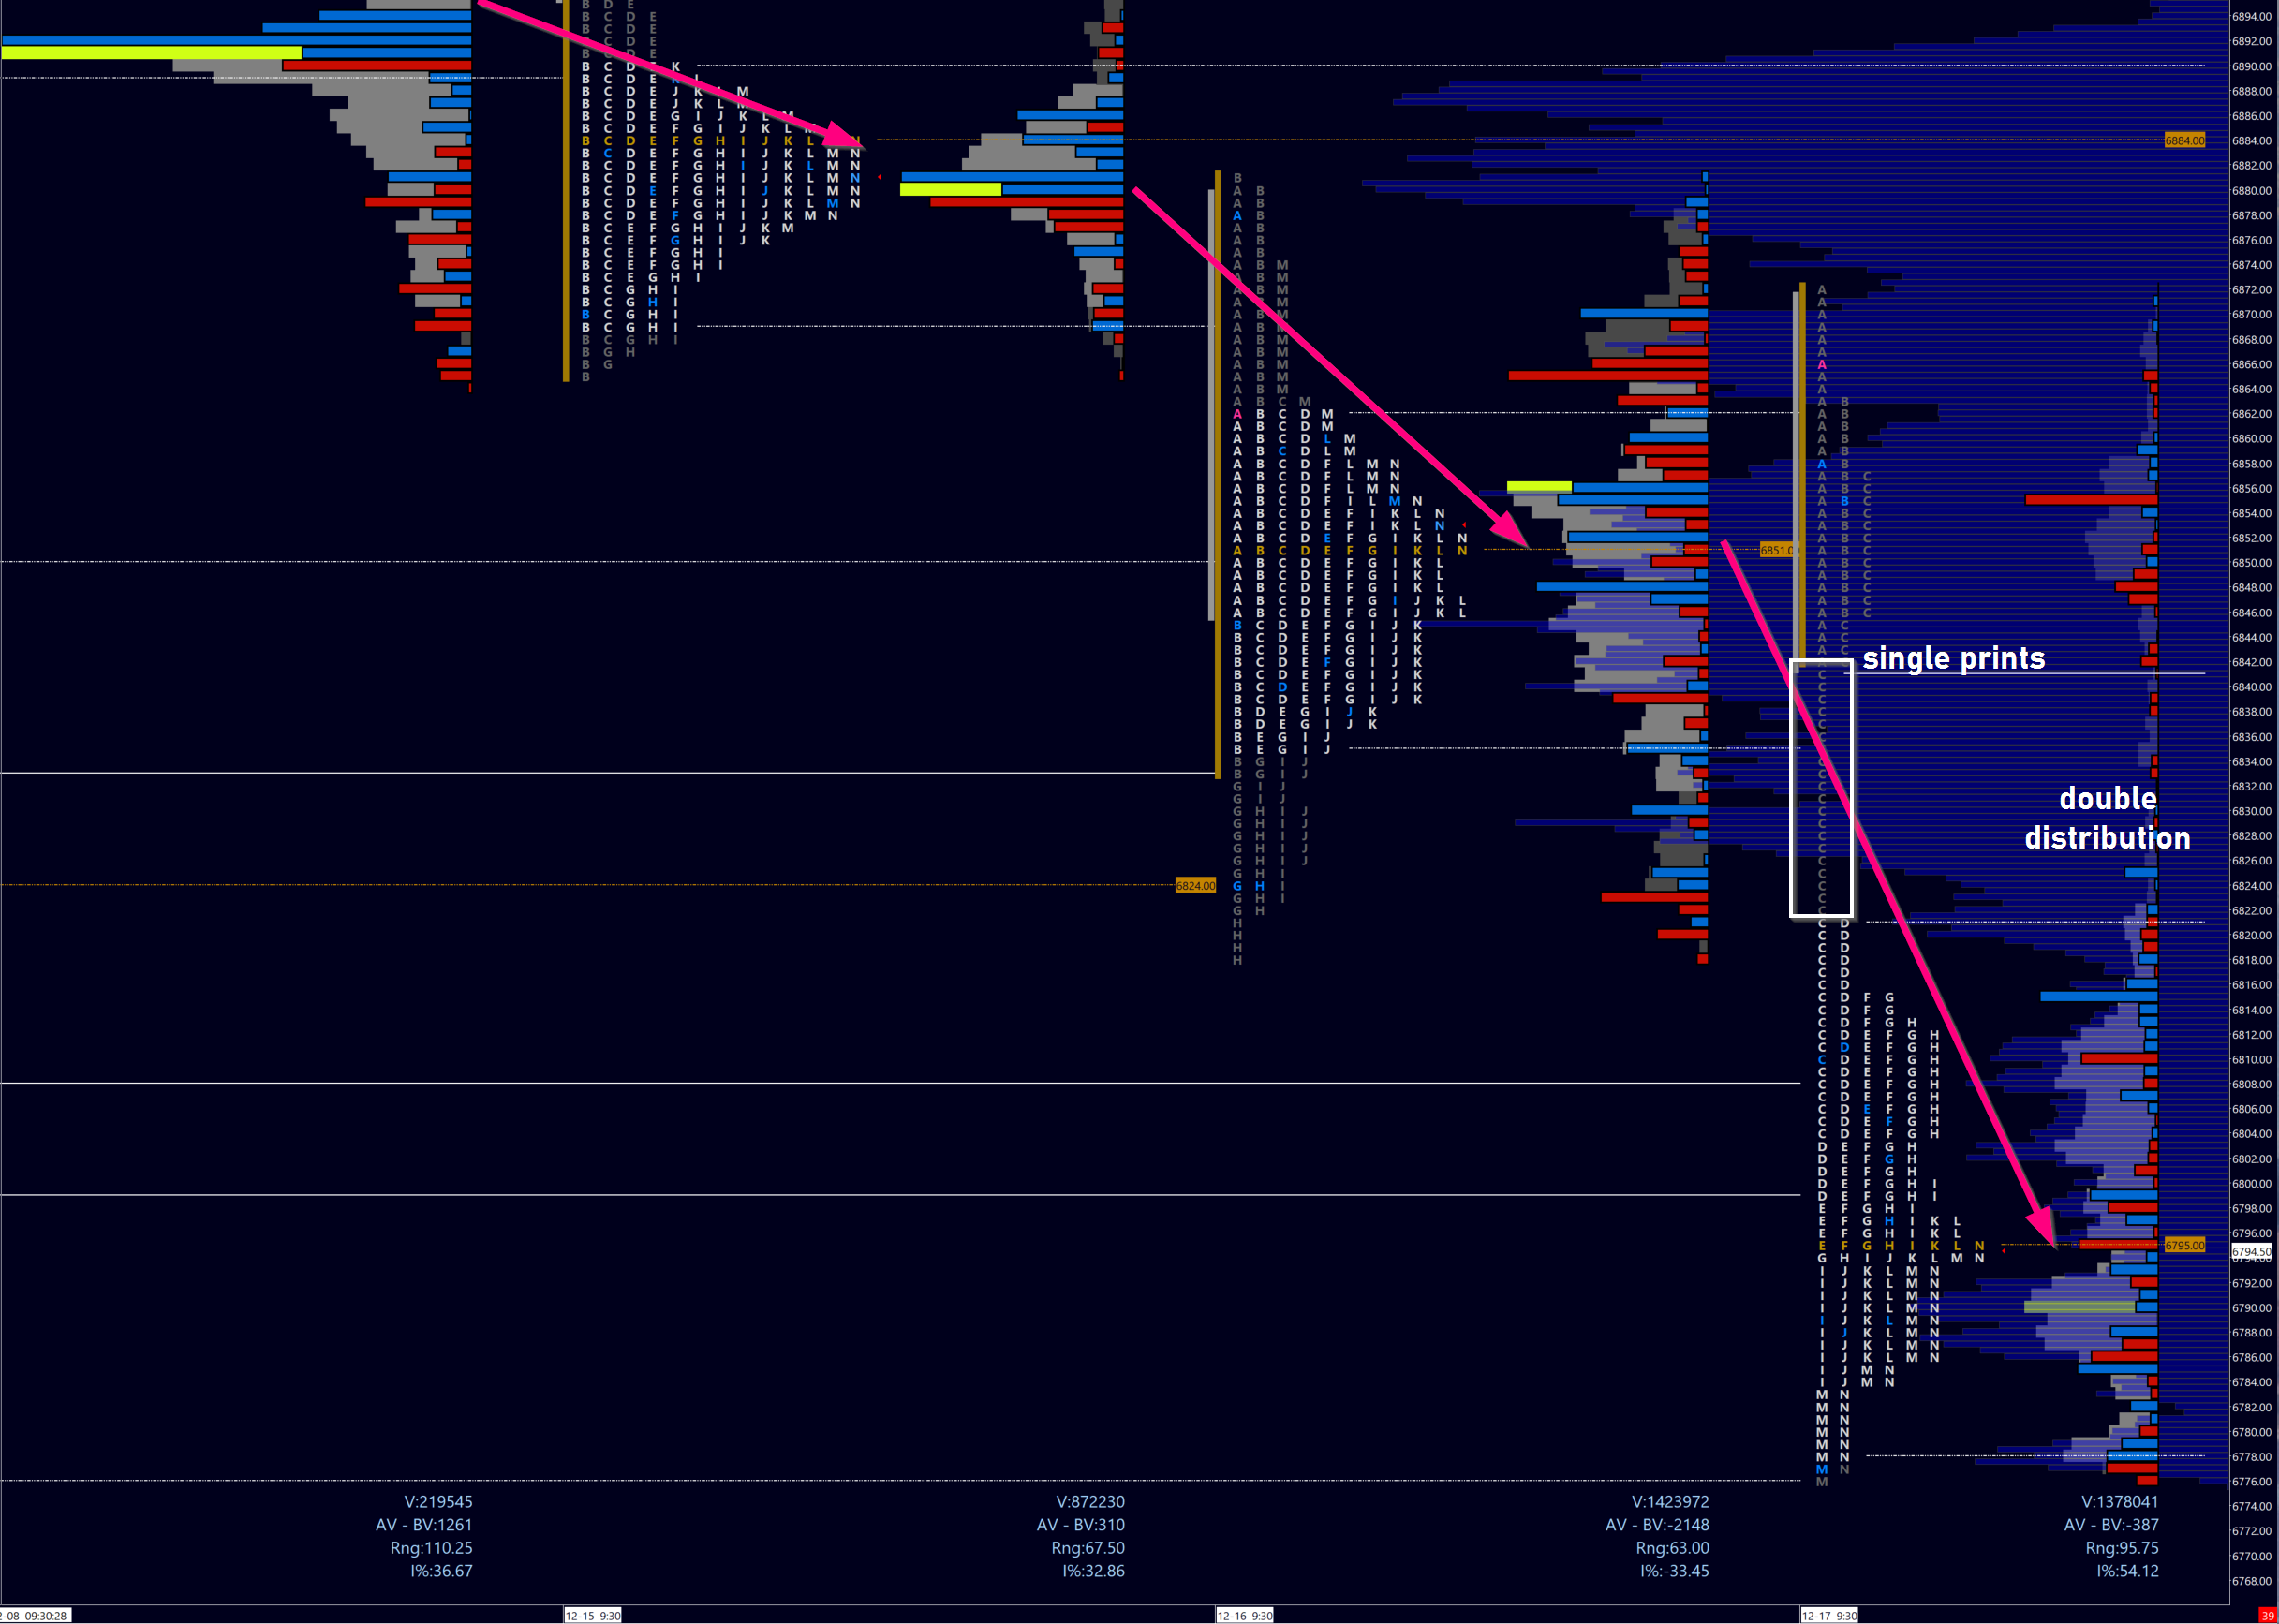
My readers will recognize that this close was very near (but above) a medium-term pivot that I had marked out months ago.
“Always look left!”:
Image 4. ES daily chart
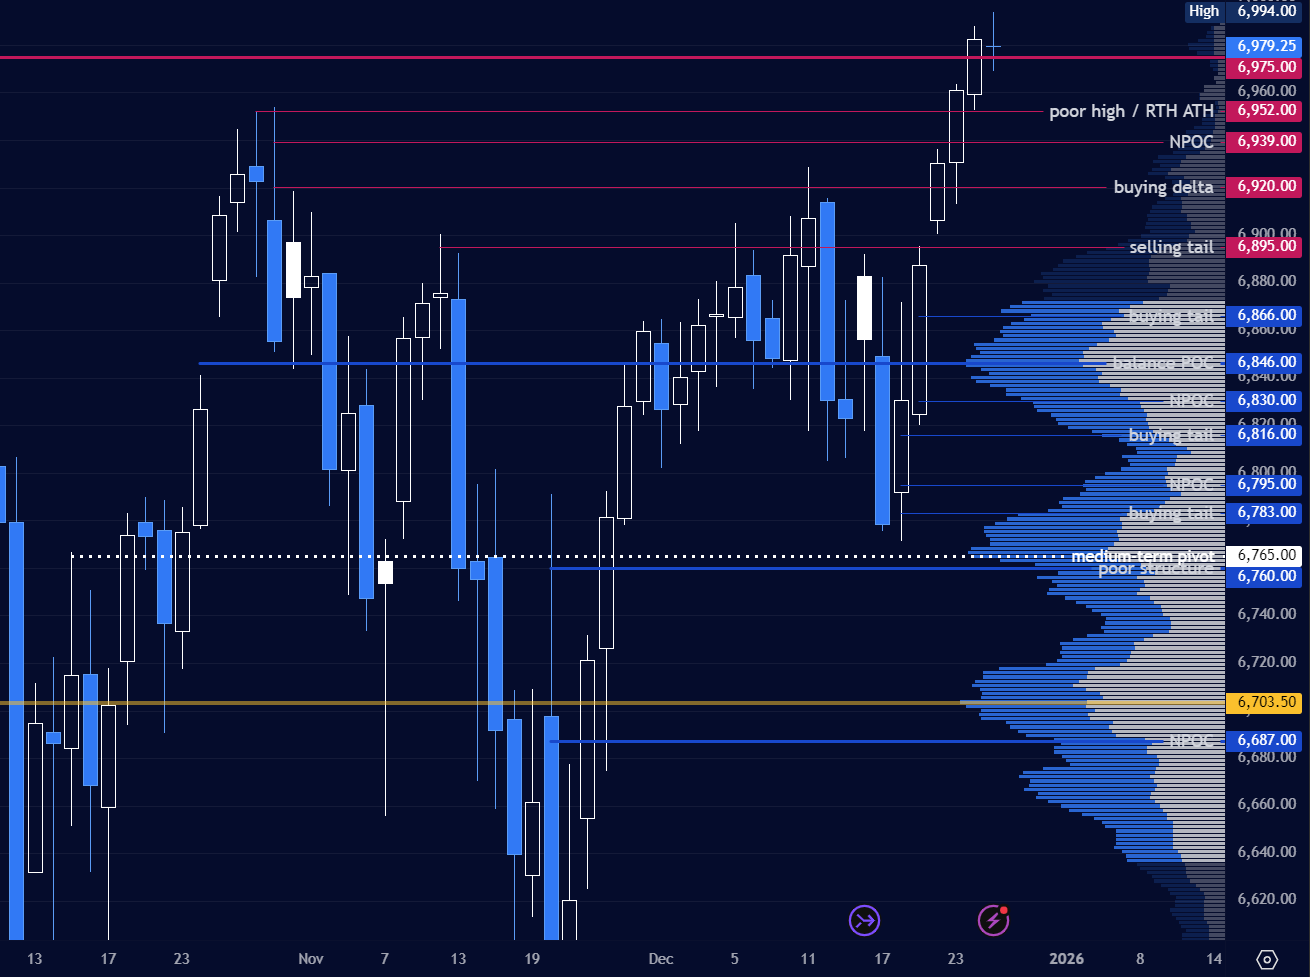
This would be a key decision point into the end of the year. Recall that my personal bet was on 7000 before the New Year, but that’s beside the point of this lesson.
Image 5. Notes from the December 21st Missal
So my read on Wednesday’s close near the lows was a potential mid-week bear trap! But as readers know, I like to see confirmation first. Ideally, some structural repair:
Image 6. ES profiles, Dec 16-18
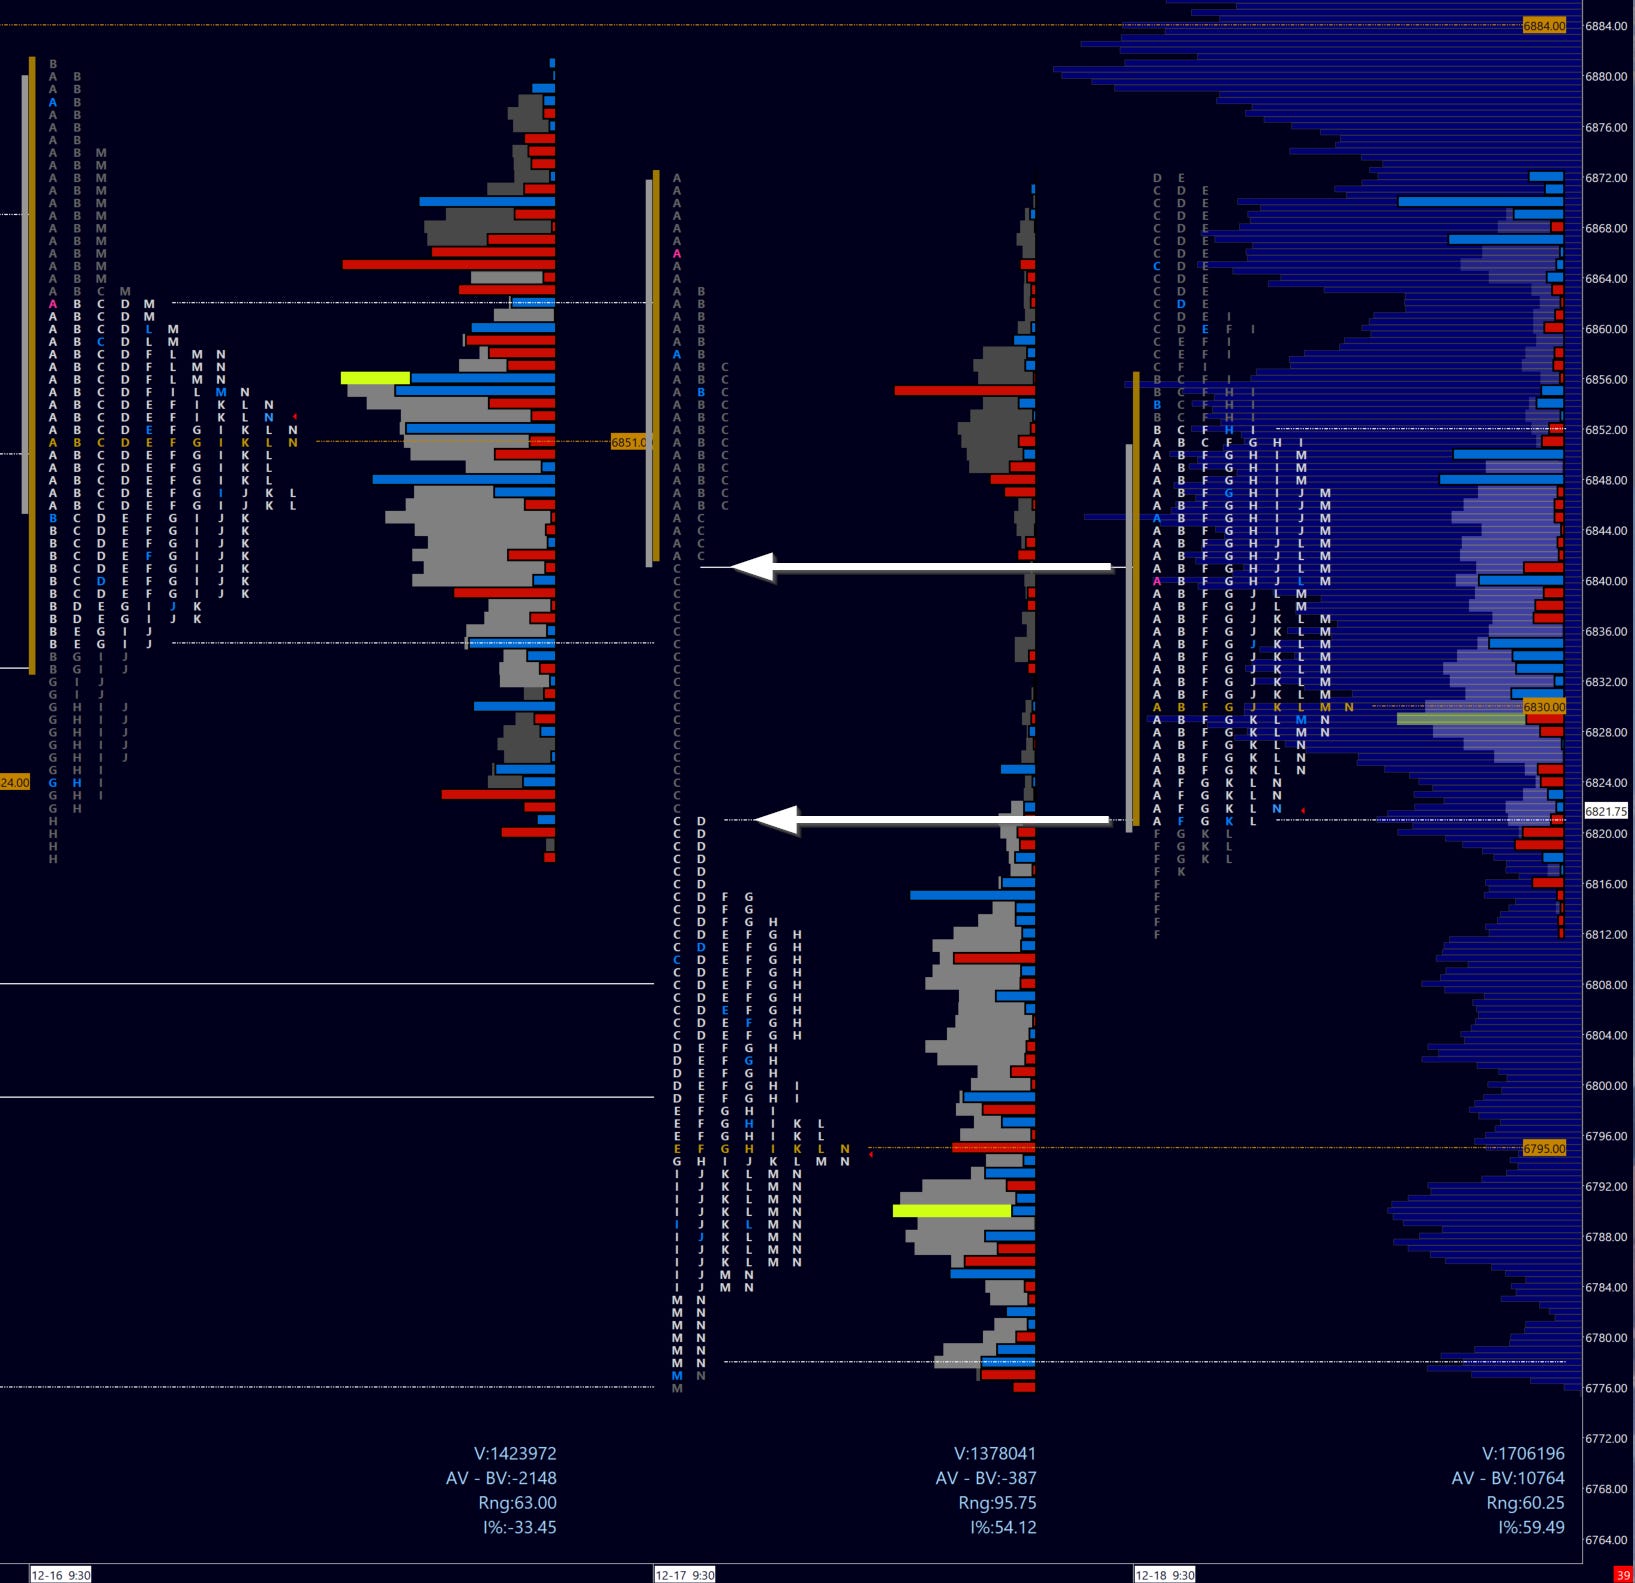
And finally, a close above Wednesday’s value. We closed just a point above PDVAH → extremely mechanical but also a very important clue.
Still, I wasn’t read to jump in. So far we know that bears may have overextended the sell, and that the lower distribution was effectively trapped on the following day. That is not the kind of follow-up that late shorts want to see.
For a long, I’d want to lean against value (POC), or even against value area high on a following session. Now I have a strong thesis going forward. Let’s see what played out:
Image 7. ES profiles, Dec 17-19
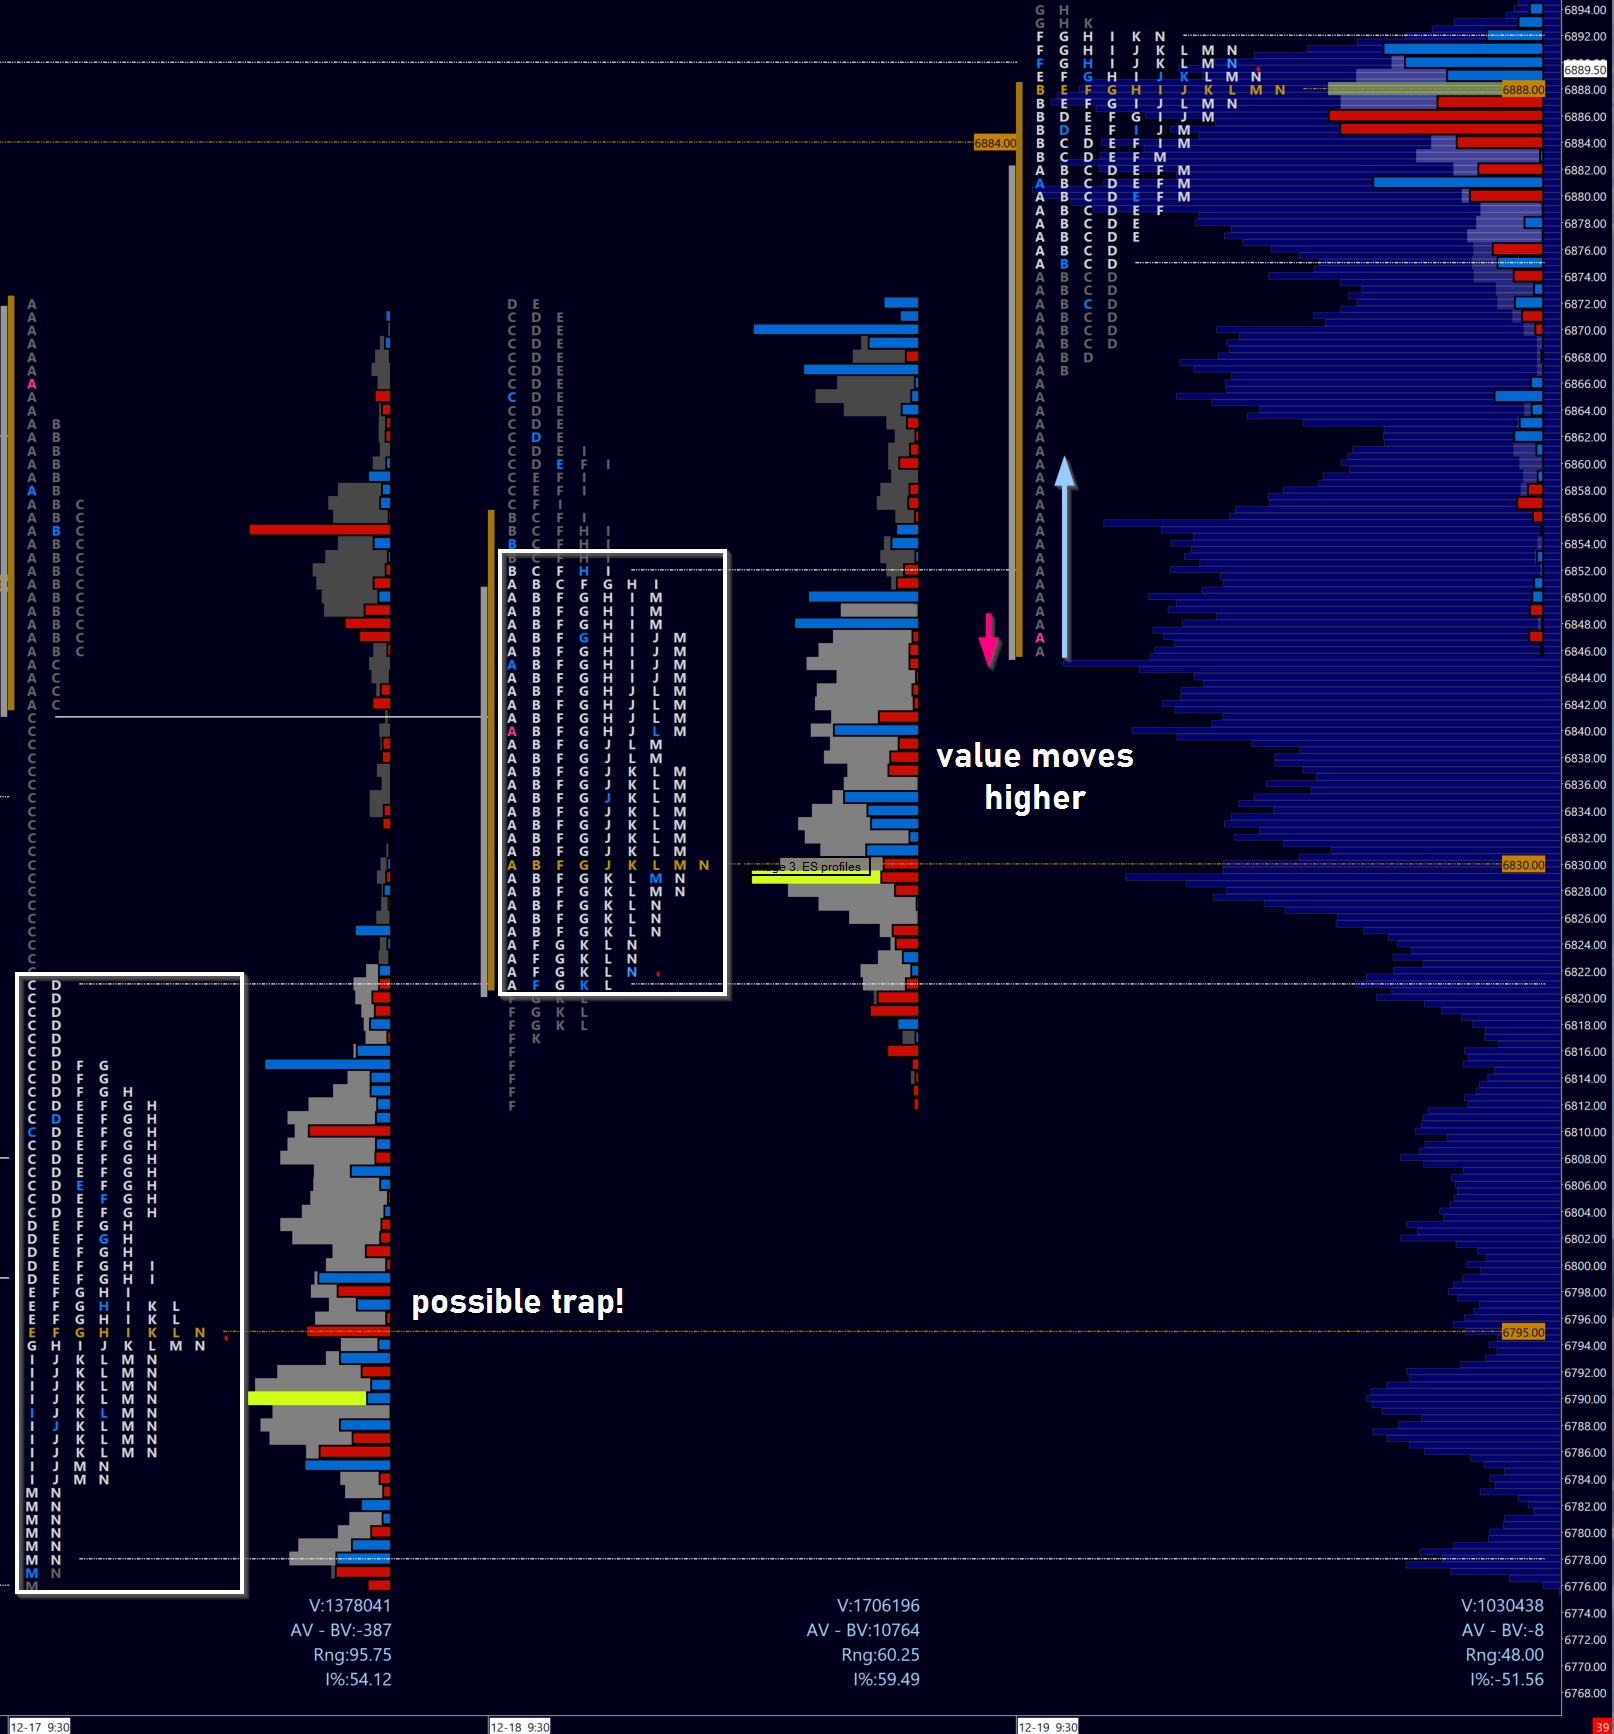
Friday opens within the prior day value area, but near the top. The real giveaway was the very small dip at the open, and a strong bid.
My Santa Rally prediction of 7k only had 150 points to go from here. I was confident in my thesis by the day’s close, which notched a few points above Monday’s NPOC of 6884.
Image 7. ES profile, Dec 19
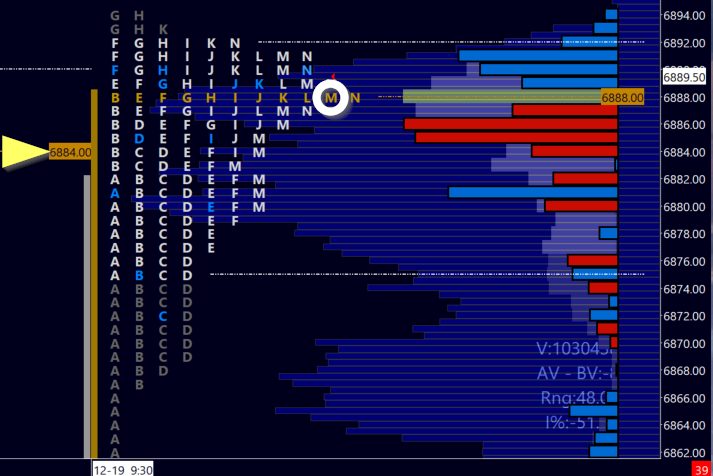
Everyone short on the week and still in trades would be forced to close out positions into the New Year on rising prices, further fueling a trend.
As a bonus, let’s see my trade on Friday below!