
From Thesis to Trade II: Profile
Integrating Tools

This series will serve to integrate trading tools and methodologies in a faster-paced visual format. My trading is fundamentally grounded in the market profile, and that is where we will start each of these lessons, which will be like slides building on each other.
Image 1. Art of movement. Prague Marionette Theatre

In this series we review the week in profile first. In following lessons we then zoom in using the footprint, and finally traditional candle charts.
Refer back to the first set of lesson, covering the profile, the footprint, and candle charts.
A great way to synthesize learning and integrate different tools.
Leveraging the Market Profile
Recall the study guide from CBOT. No sign-up necessary.
Image 2. ES profiles. Areas in review, October 13-17
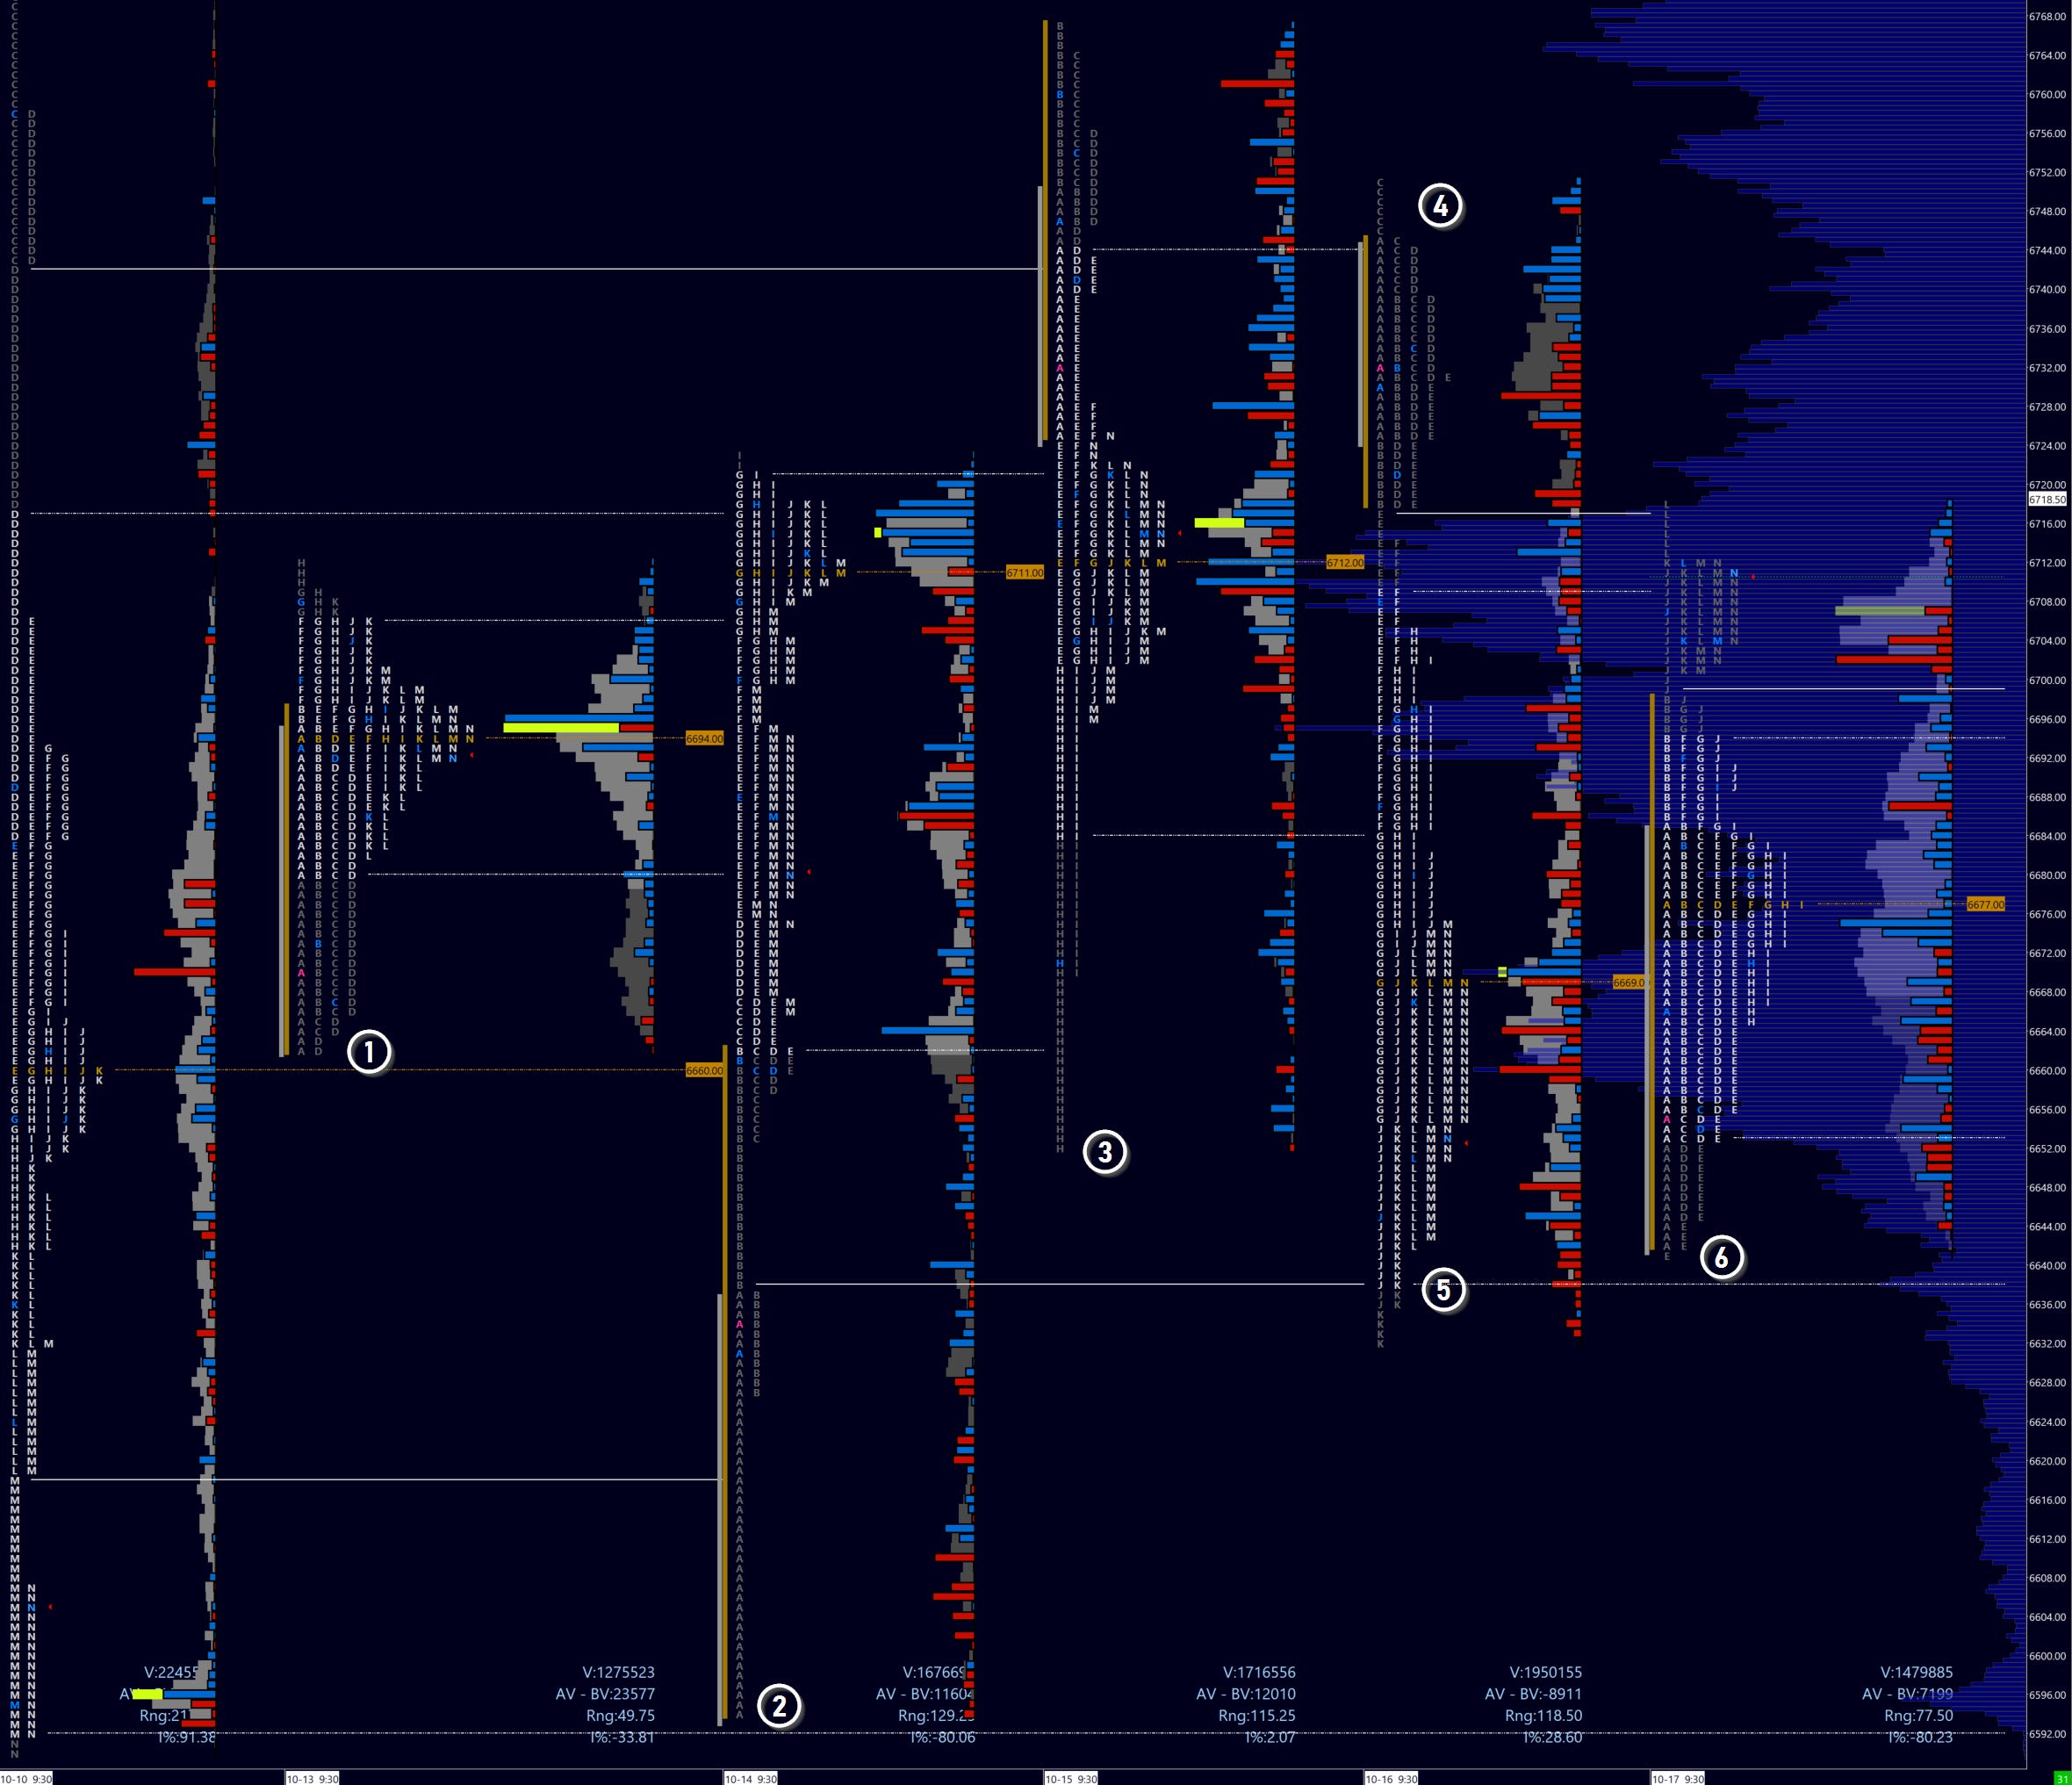
We use the profile to review each day of the week below. I’ll focus more on the movement of price - the price action - around key levels, and what to expect. If the reality shifts from what we know is typically the outcome at certain references, we must change our thesis accordingly.
As the market is presenting you new information, it is also showing you valuable clues.
Monday, October 13
Image 3. ES profiles
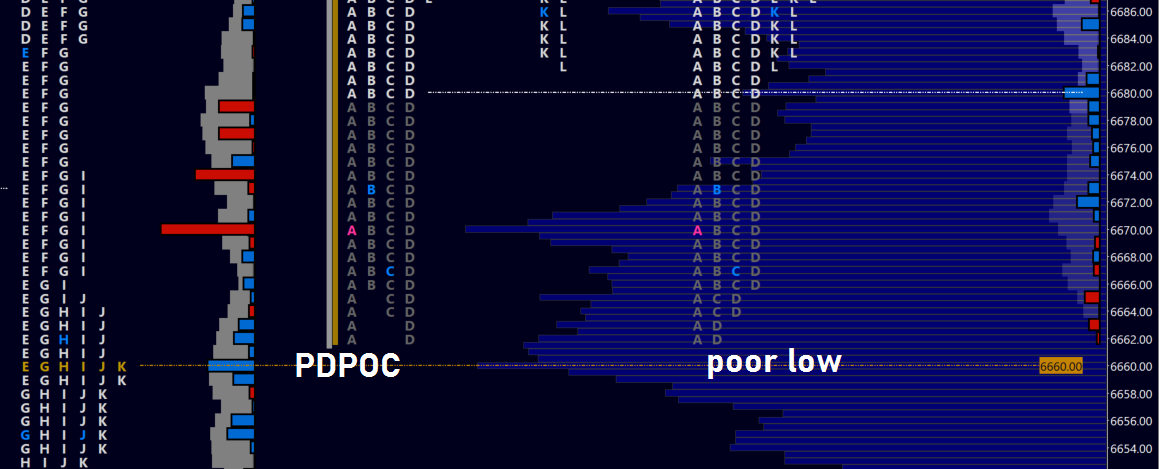
Reminder: always ‘look left’. Doesn’t matter if it’s a candle chart or TPO prints.
Observe context.
The example above is critical. And the ability to tell the story in D period would make a killer trade into the close on virtually no risk. So what happened?
First, take a look to the prior day POC. This is a clear reference, and as we saw in the stat tracker - an extremely reactive level in the last quarter. Sellers were unable to tag this level at the open (A period), despite the high momentum. Now seller strength is put in question.
And that question is put to rest by D period. once again, we spend a lot of time in two-way trade around a wide range, but sellers are unable to make any further progress to test the PDPOC, just a couple of points away.
All this leads to trapped sellers at a poor low. It is almost imperative to take a long at the poor low, with a stop a couple of points below the POC. After all, what’s a four-point risk?
Let’s review the context in the remaining examples!