
From Thesis to Trade II: Footprint
Integrating Tools

This series will serve to integrate trading tools and methodologies in a faster-paced visual format. My trading is fundamentally grounded in the market profile, and that is where we will start each of these lessons, which will be like slides building on each other.
Image 1. Trust the process. Matthew 14:22-33

You can find the first set of lessons, covering the profile, the footprint, and candle charts.
This week we continue where we left off on the last lesson on the profile, integrating the footprint below and the candle charts in the coming days.
Referencing the Market Profile
See the study guide from CBOT for a real in-depth course. No sign-up necessary. Although we do better (and more timely) visuals at the Crowstack!
Image 2. ES profiles. Areas in review, October 13-17
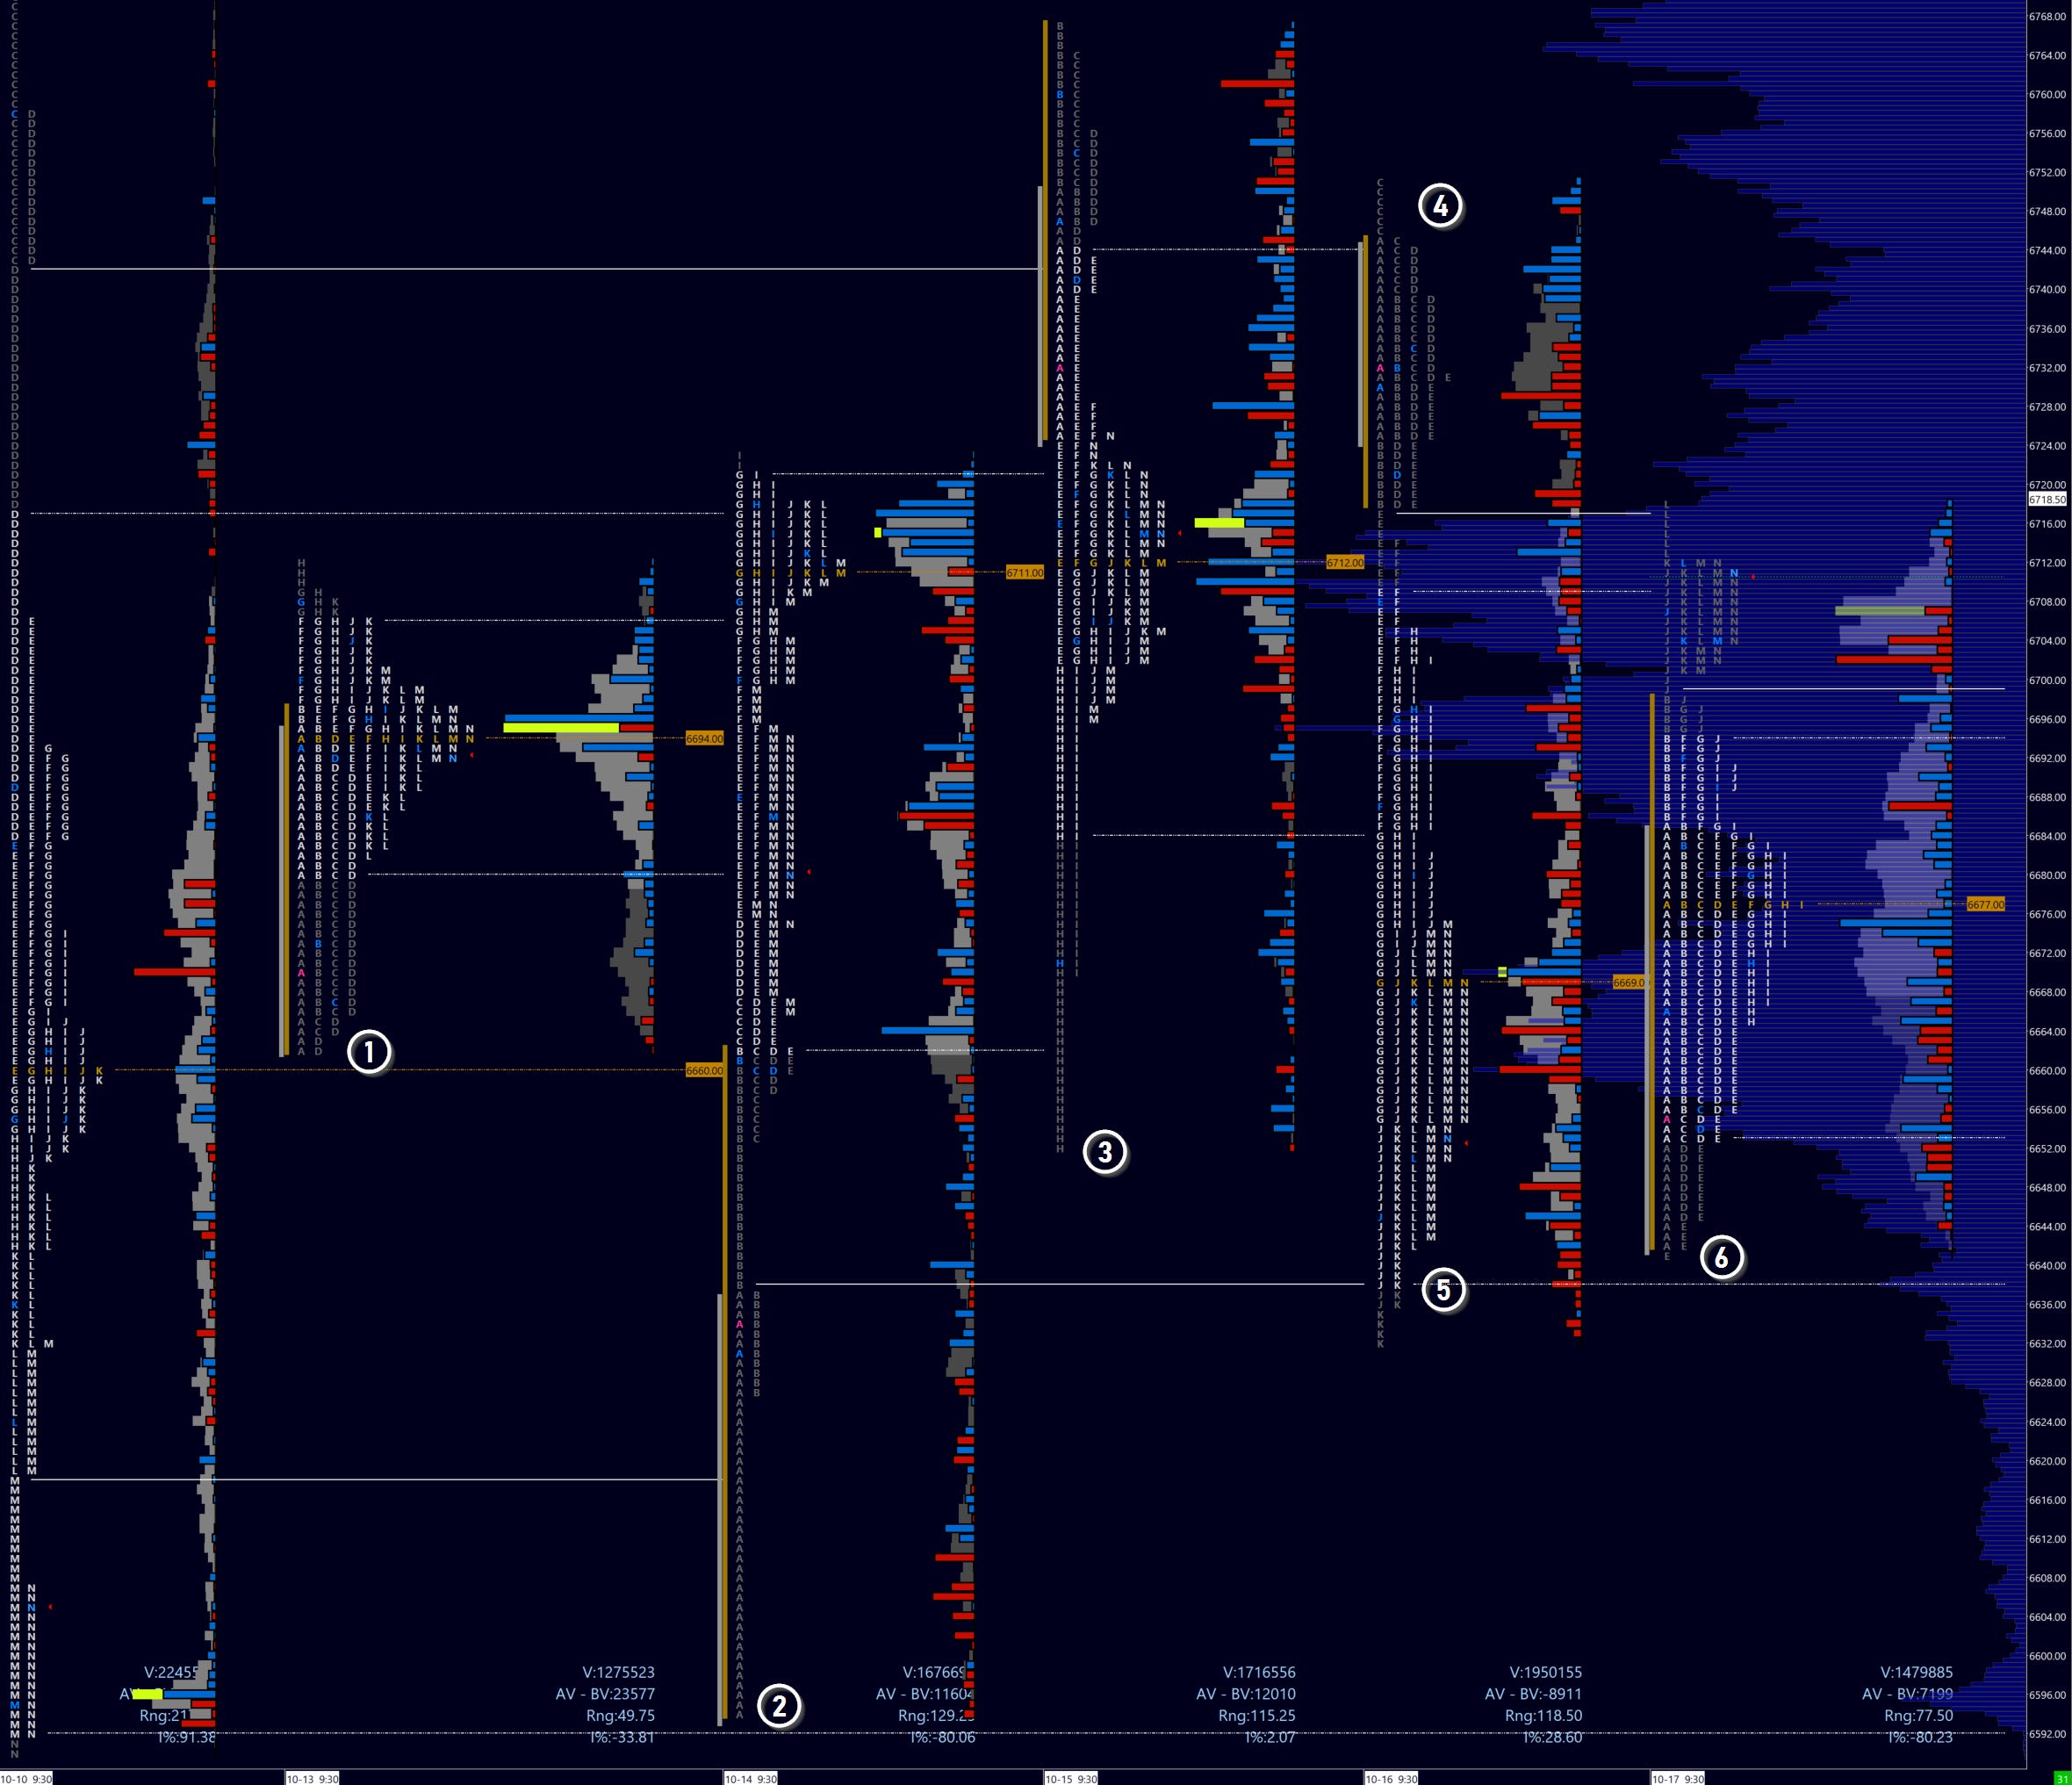
We’ll review each of the areas in profile above again in the following section, adding in slides from the footprint, identifying areas of abosrption, exhaustion, and counter-initiation - if applicable.
Monday, October 13
Image 3. ES profiles
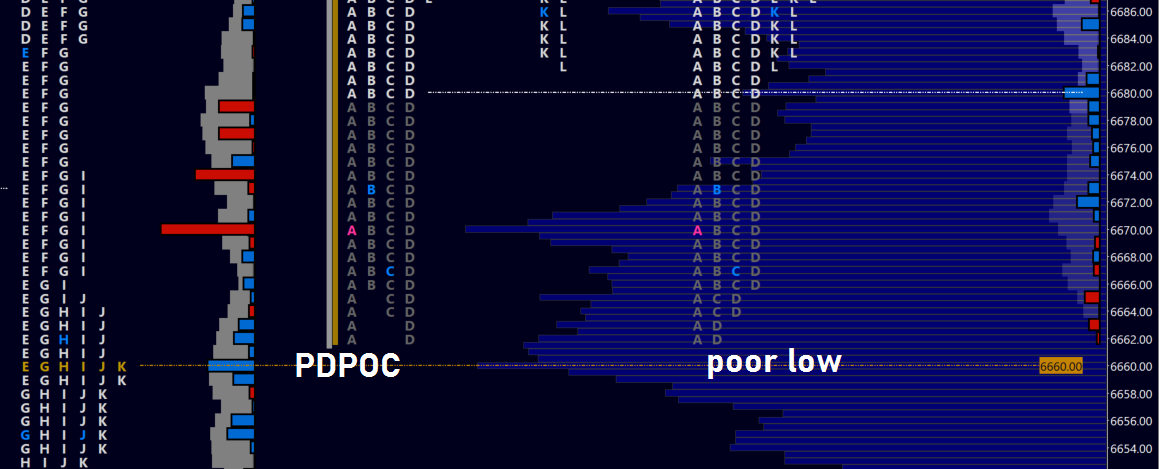
A classic seller trap. But as we’ll soon see in the footprint below, these were very weak sellers. More like a vacuum of bidders from the open until the 6666 (!) level. Yes, markets are subject to dark forces.
Image 4. ES 5m footprint
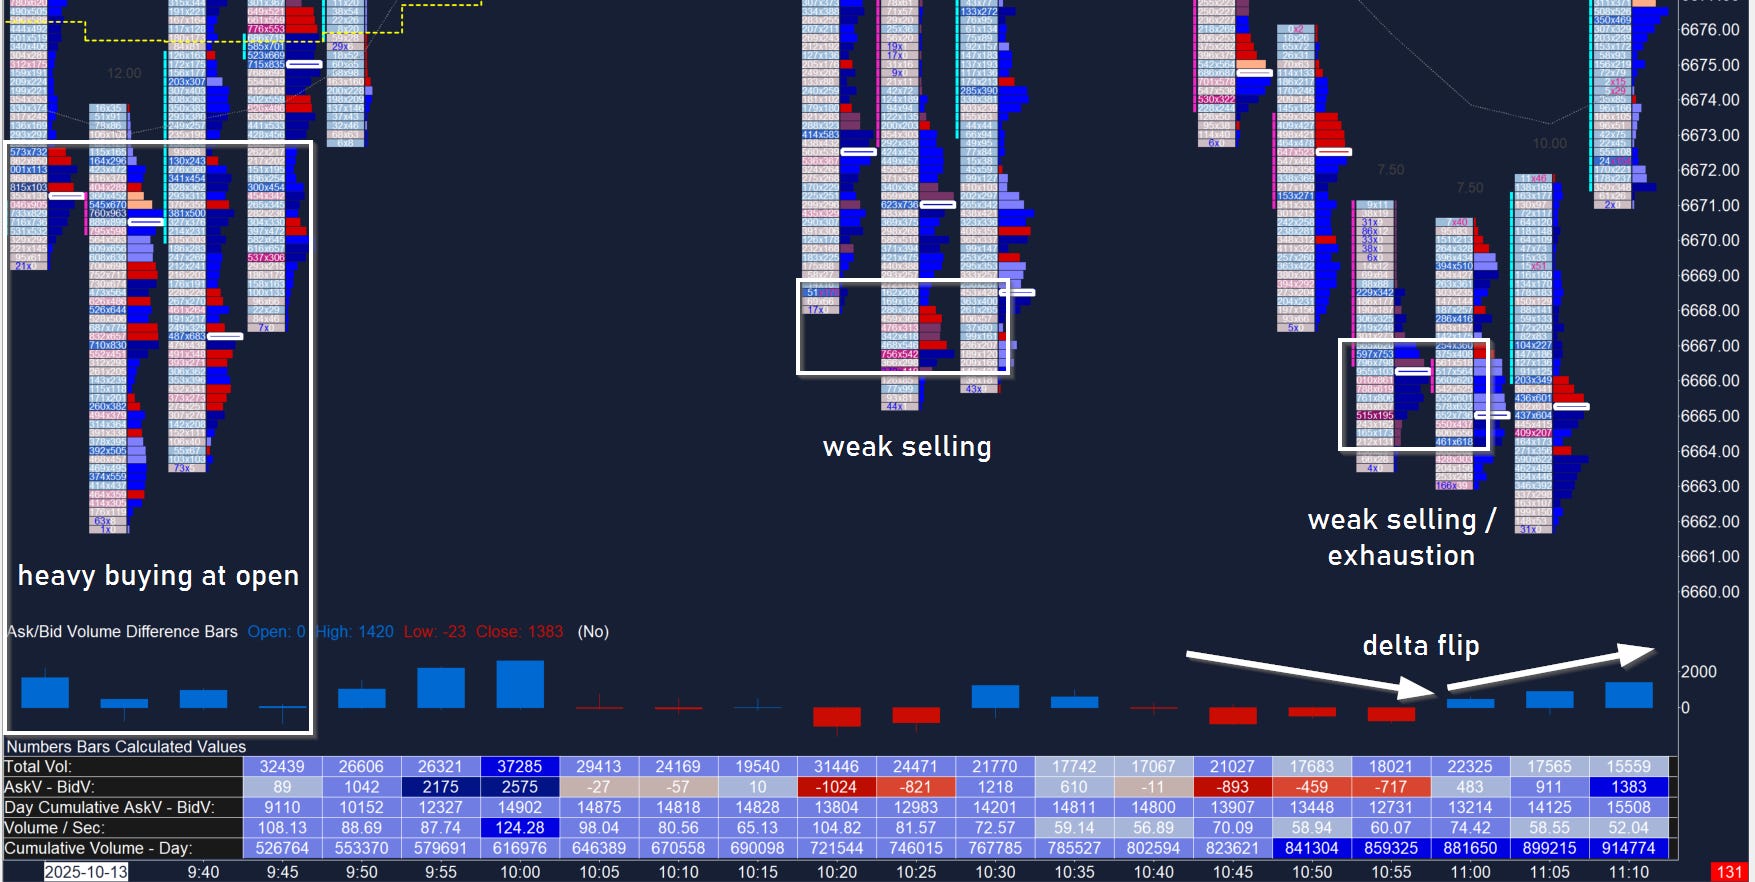
OK so let’s zoom out on this. We see the A period sell down into willing buyers. Look at all those blue delta bars in row two! That blue ‘V’ shape indicates very strong interest.
We come back to this area later on weak selling. Although we are shaking out weak buyers in the process.
And finally a third time in D period. The key to a great entry here was a) recognizing a poor low forming; b) waiting for a delta flip; and c) waiting for the period change at 11h00EST!
It’s then that the counter-bid at 11h05 on blue delta makes perfect sense. As does a juicy long on the back of trapped sellers. Are you enjoying putting the pieces together? Let’s move on!