
From Thesis to Trade II: Candle Charts
Integrating Tools

This series will serve to integrate trading tools and methodologies in a faster-paced visual format. My trading is fundamentally grounded in the market profile, and that is where we will start each of these lessons, which will be like slides building on each other.
Image 1. Know the right exit
You can find the first set of lessons, covering the profile, the footprint, and candle charts.
Look back to this lesson on the profile in this series, as well as the following footprint analysis. Below is the chapter on integrating candle charts to execute trades.
Referencing the Market Profile
See the study guide from CBOT for a real in-depth course. No sign-up necessary. Although we do better (and more timely) visuals at the Crowstack!
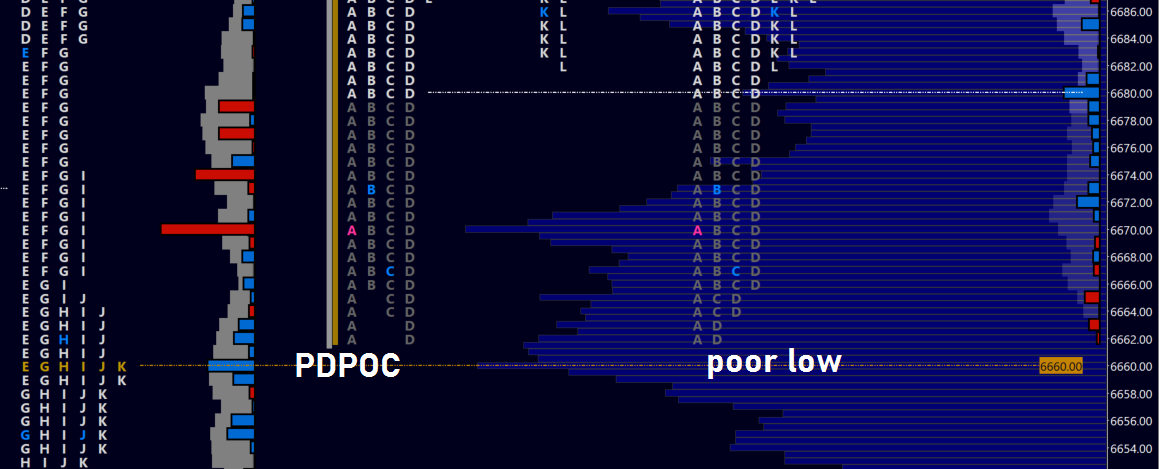
Image 2. ES profiles. Areas in review, October 13-17
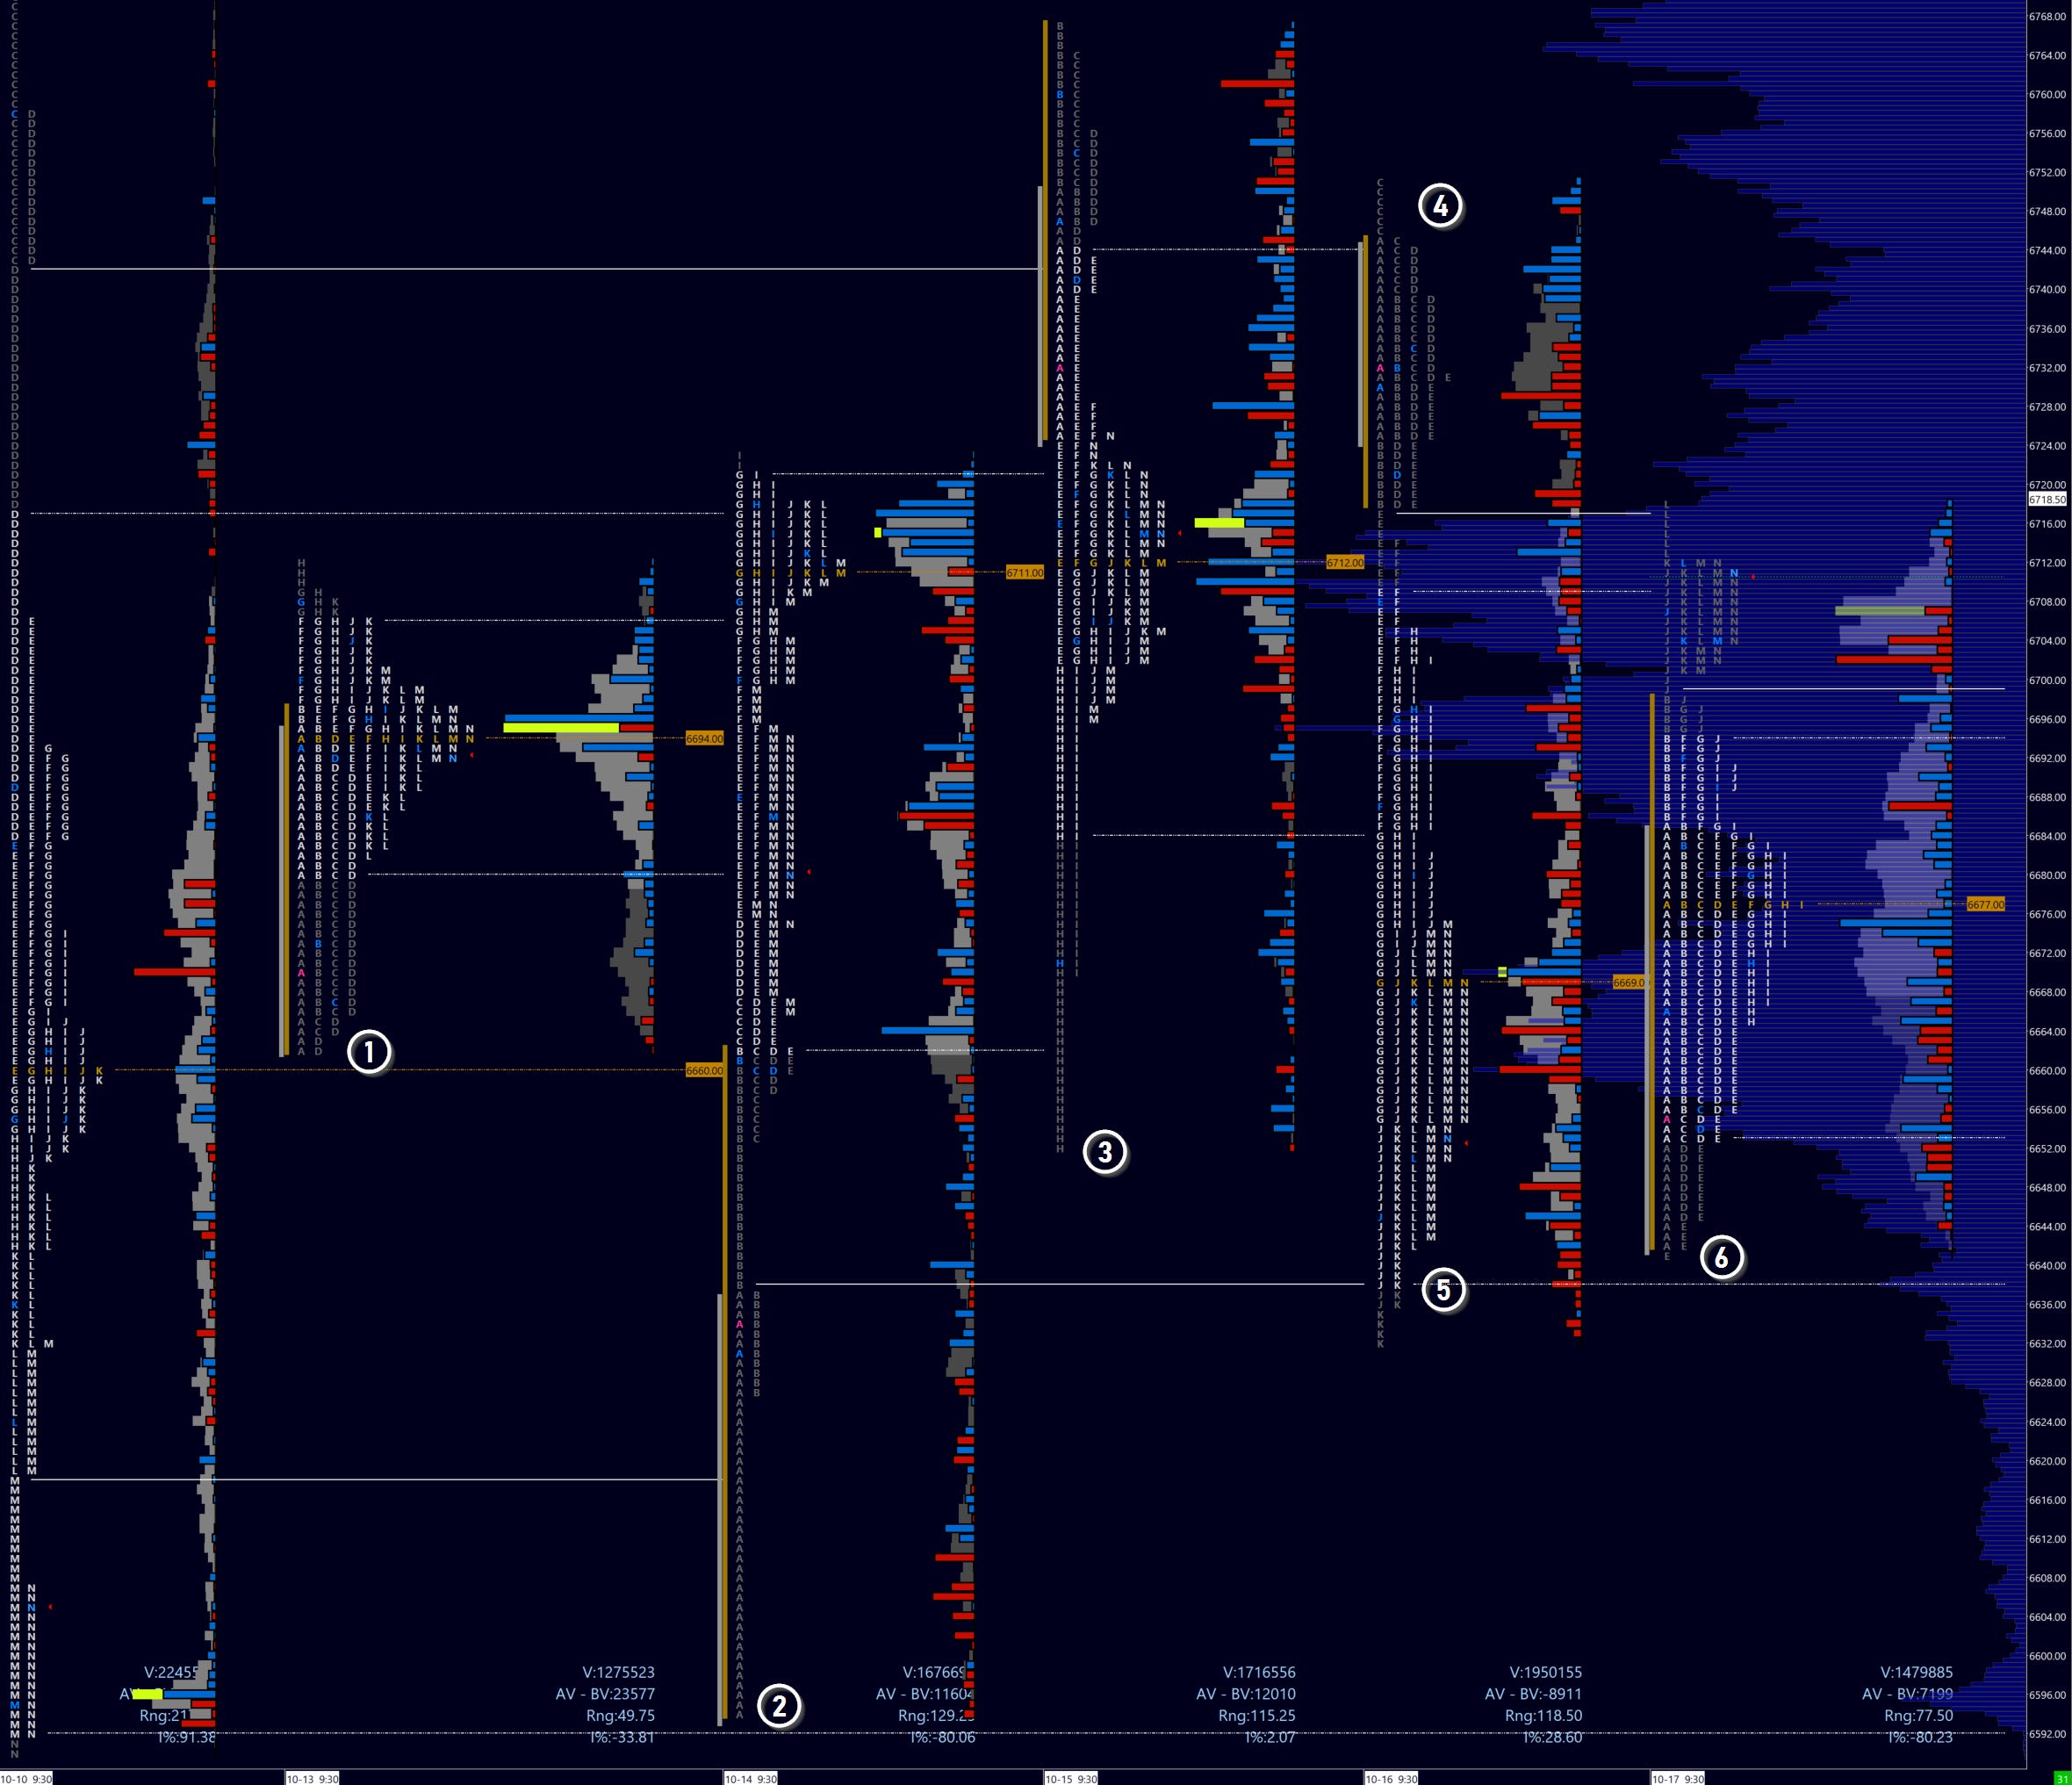
Recall the areas in profile above. With our thesis in place (refer back to the lessons above), we use the candle charts to execute trades below.
Monday, October 13
Image 3. ES profiles
A classic seller trap which we always maintain as a possibility in our minds, regardless our bias.
Image 4. ES 5m candle charts
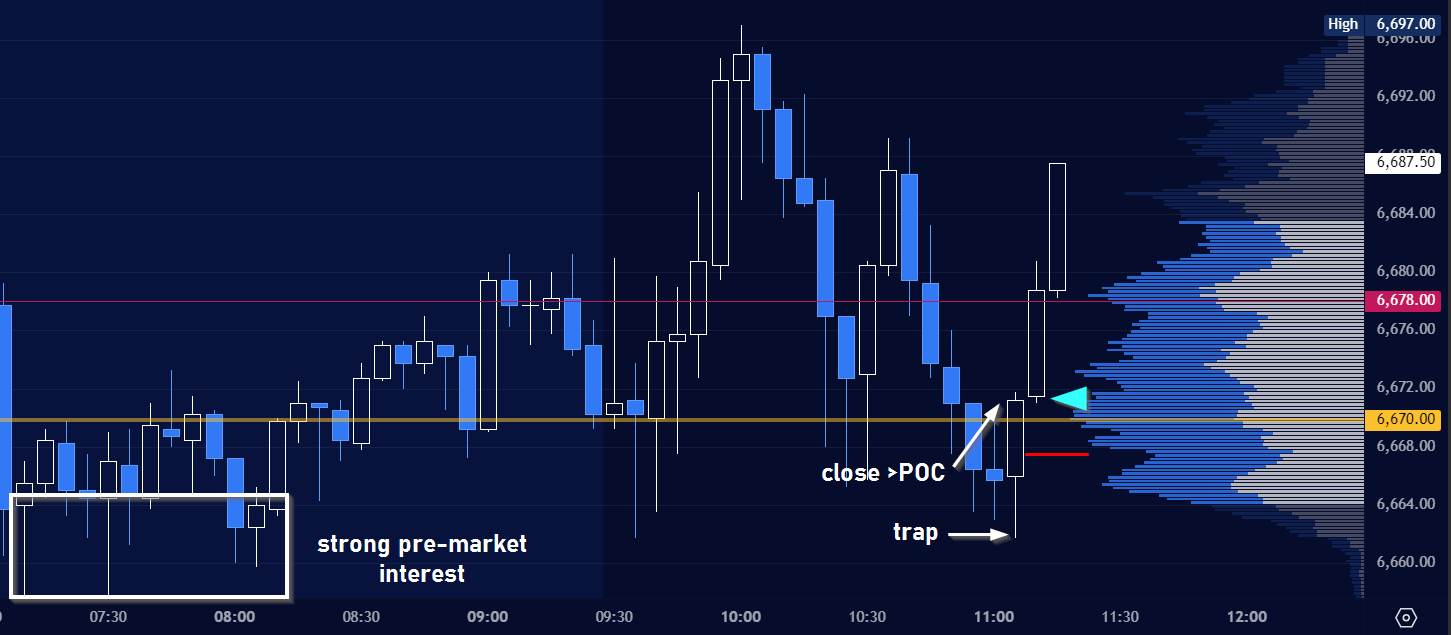
Already we have some key clues on buyers strength in the pre-market. Note that buyer interest established a floor near 6660. We should be watching the top of that area for renewed interest.
Which we find at the open. Buyers push to the upside but see no follow through. Sellers do make a lower low into the European close, but barely. With that selling volume off the table, buyers step back in. Seller weakness is evident by the very little time spent at new lows.
This should be a no-brainer. Wait for price to close over the developing POC (yellow), effectively trapping later sellers. Long the following 5m candle on a strong open - we saw barely a dip. I play a stop a couple of points below the day’s open.
Let’s look at four more very educational examples: the real money-makers.