
Footprint Course: Trading Bottoms
March 10-14, S&P500 (ES)
Each week I review key moments from recent price action in the indices. These instances will be analyzed using three methods: the tape / DOM; footprint; and candle chart. Synthesizing the three allows an understanding greater than the sum of its parts, leading to a complete understanding of the auction process. While there are many great resources out there, I am not aware of any that provide such a comprehensive study guide.
Image 1. guerillastocktrading.com

Let Other Birds Find the Bid
Examples from the footprint charts. In this series we explore the three primary concepts revealed using this tool with regard to ‘turnarounds’ in the price action: absorption, exhaustion, and counter-initiation.
You know it’s coming:
“Don’t look for the bottom, let others find it for you.”
We had many opportunities this week to trade intraday reversals, with just as many opportunities to blow your account. Don’t feel bad if you’ve experienced losses, even as a seasoned trader. This is an entirely new market since the Trump administration came into office and many old strategies simply won’t work as well, or at all.
The footprint is a great tool to help you identify what can be a tradeable bottom - exhaustion leading to a counter-bid. I will cover examples from the prior week below, with the goal to increase your confidence in using this tool to refine your entries and minimize risk.
Image 2. ES 5m footprint, March 10
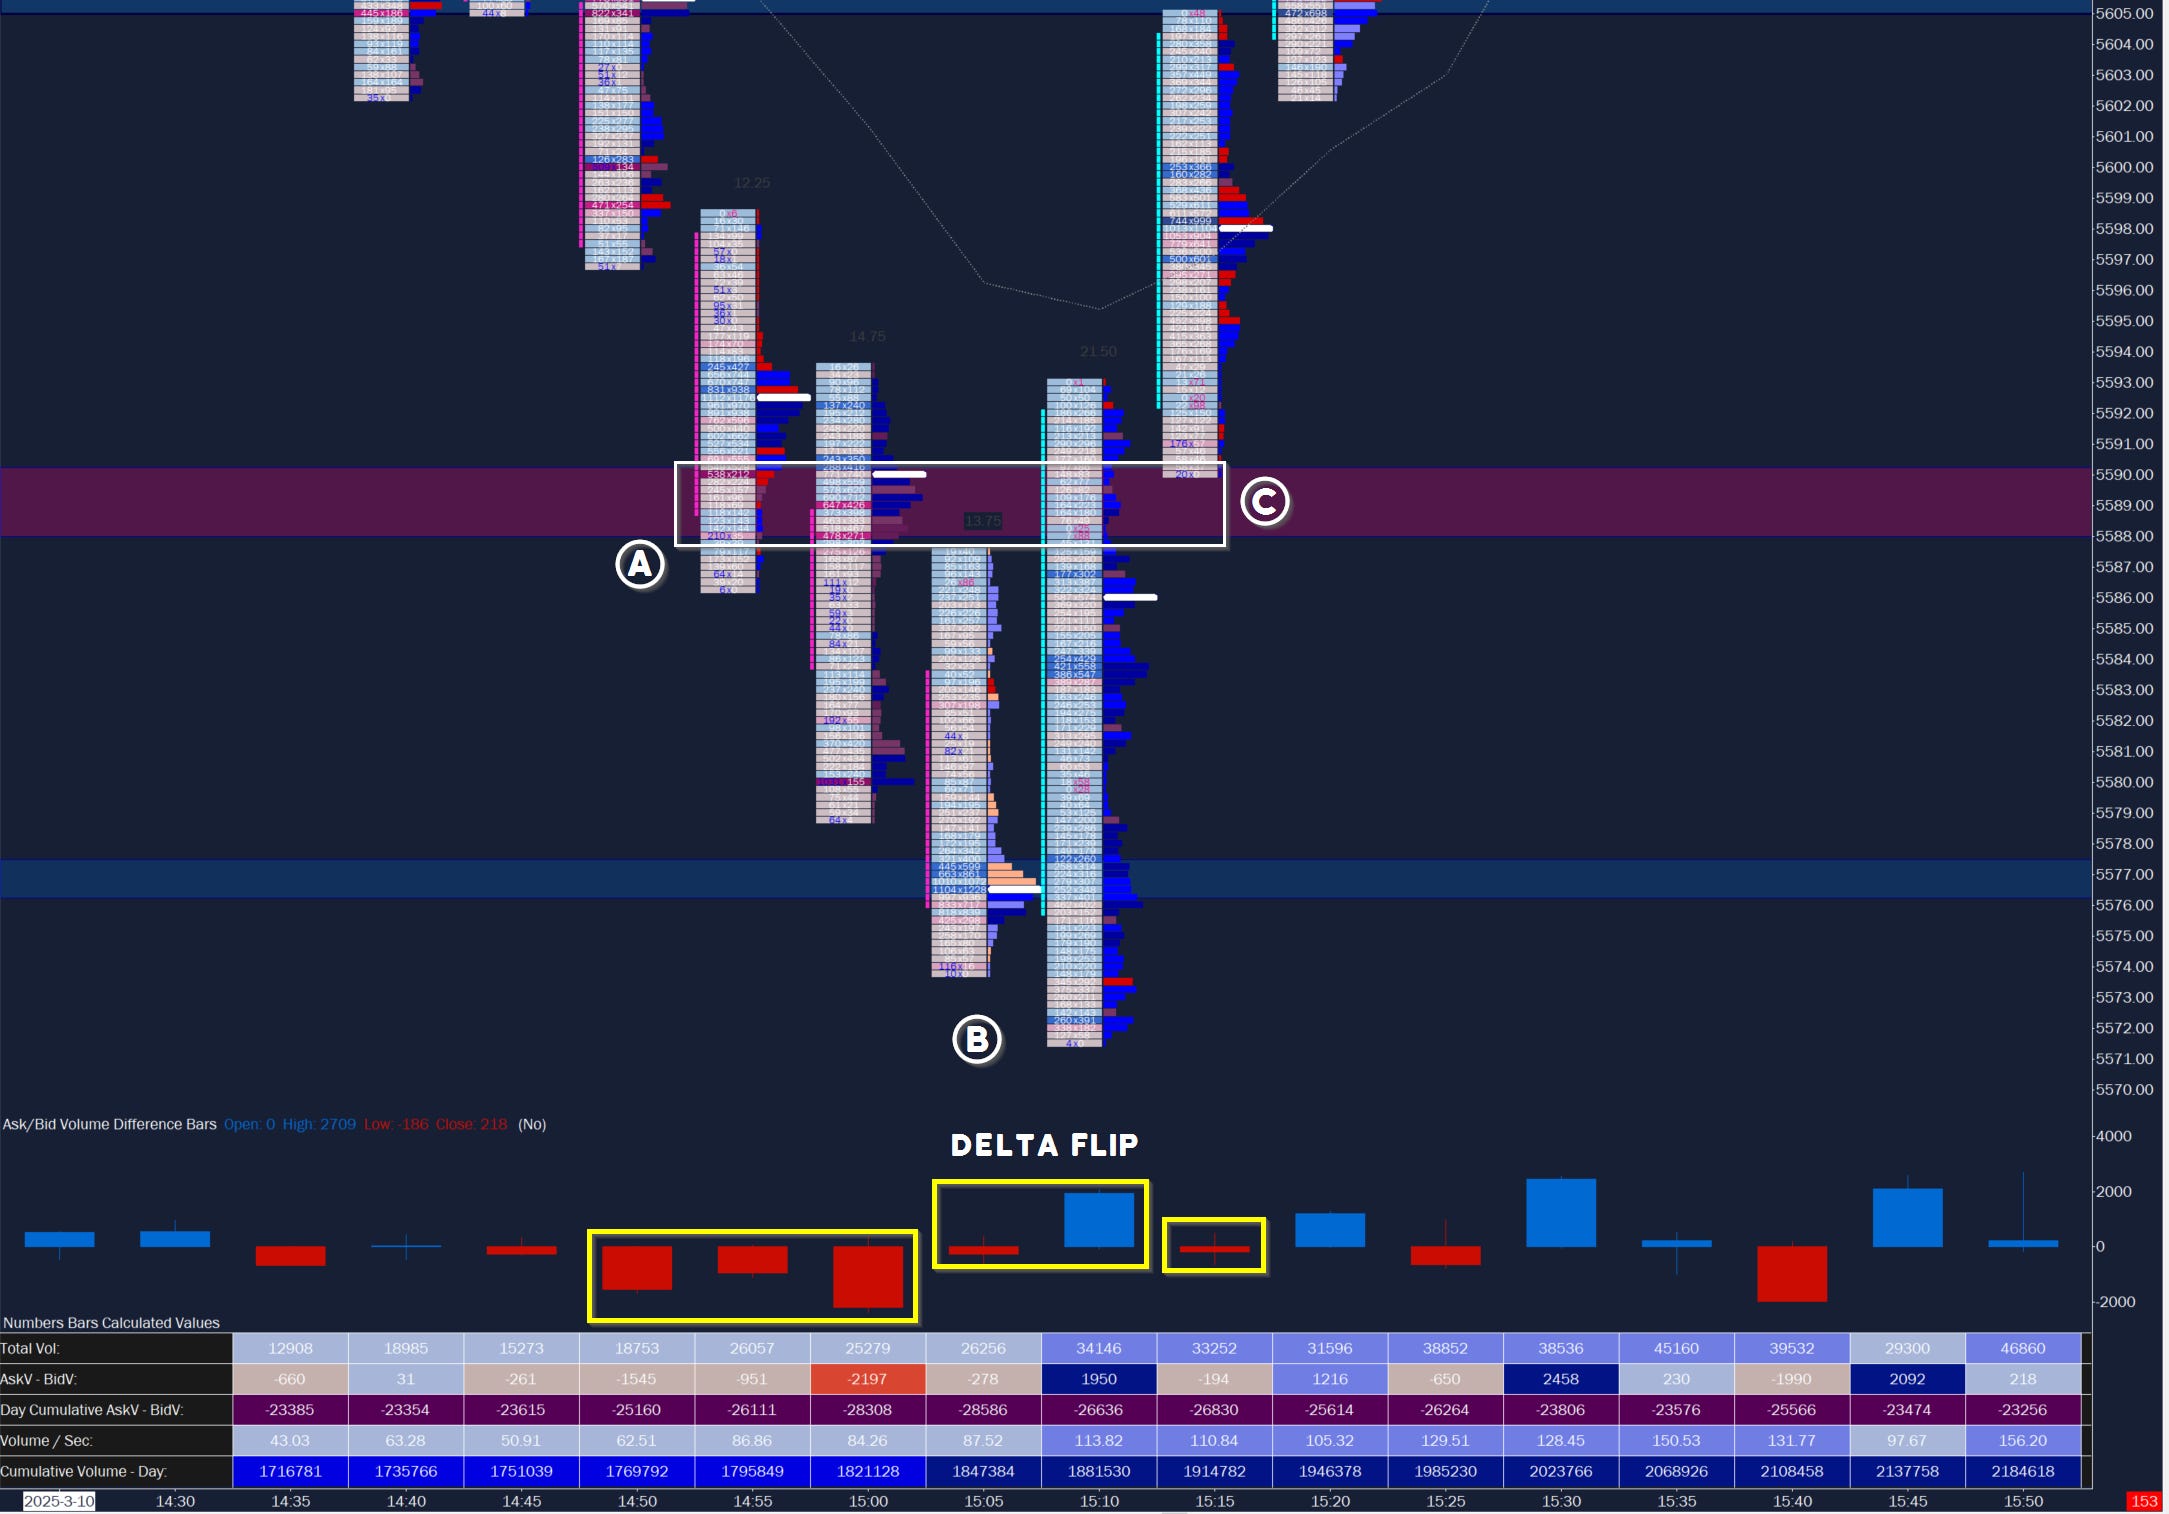
A. The day was effectively one-time-framing down: a train is not something you want to step in front of. With the fail of 5650 shortly after IB with only a mechanical bid to support, a cleanup of prior poor structure from months back would be the next possibility. Followed by a key test of even number 5600, and finally we had NPOC 5575 on watch. It is important to at least have levels in mind, and be able to interpret context when they trade rather than entering a trade blindly.
Note the context at 14h50. We are ten minutes away from a period change and sellers are extremely aggressive below psych level 5600, note the high negative delta as well as the tape bombs clearing the bid (highlight with dark blue numbers in the footprint, for example 111 x 12, 19 x 0, 35 x 0).
B. Trading into the NPOC 5575, the cumulative delta is still negative (red), but has suddenly dropped to only -278 contracts as we enter the L period (15h00EST). This is the beginning of absorption and buyers stepping in. The delta flip is key as we now have evidence of stronger buyers overwhelming sellers. The outside bullish candle helps, too.
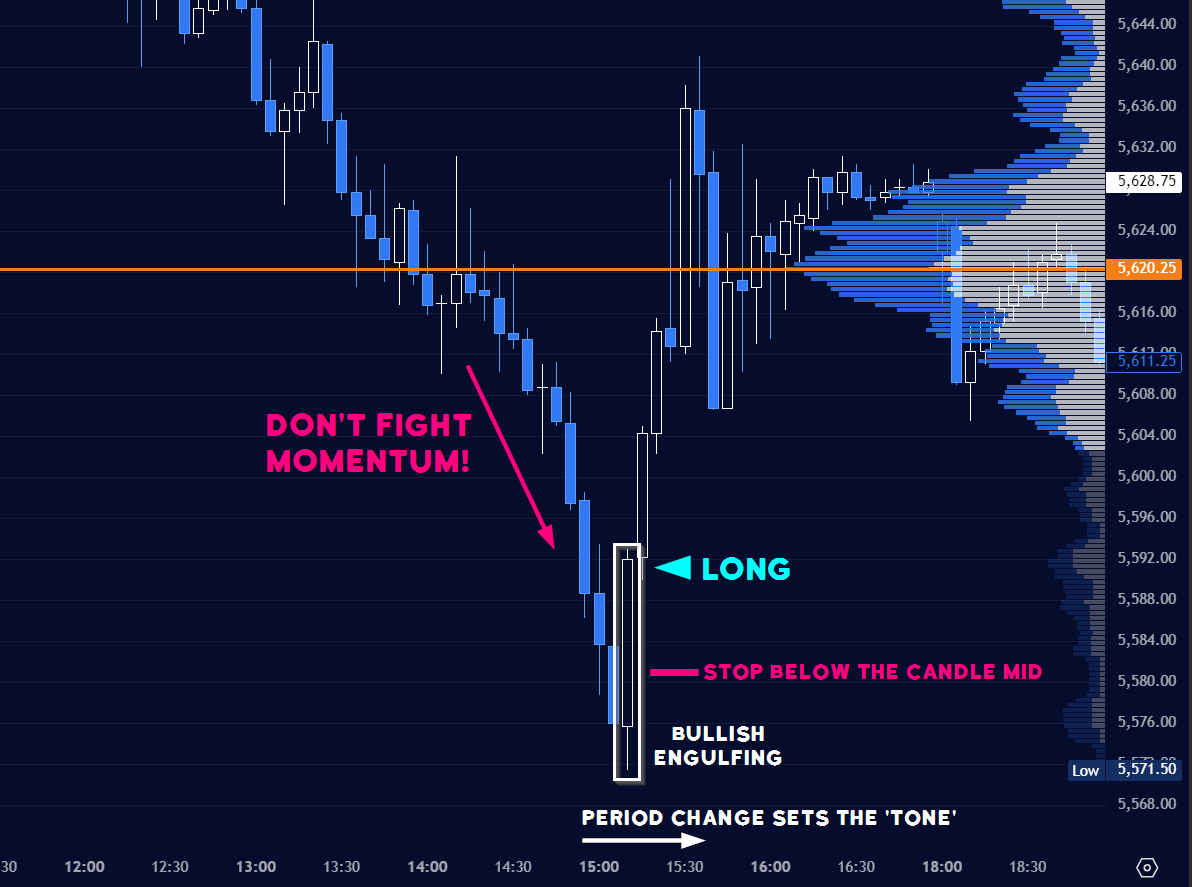
Image 3. Notes from the 5m chart
C. Note the red liquidity band extending from months ago, as well as the white highlighted zone. I noted it intraday as heavy sell was visible here on the footprint (higher red delta bands in the candles, and outsized cumulative selling delta), as well as confirmation of the validity of the prior band. Any late-day rebid might see these late (trapped) sellers look for an exit.
That thesis was correct as the 15h15 candle opened with a small dip into the zone before short covering sparked into the close. That band is precisely where I hit market in - on some 0dte calls, please don’t do that though if you’re a new trader! A mini or a few micros would have been fine here.
The two same day weak lows we will cover next were far easier - and more profitable!