Every week I will review key moments from recent price action. Each instance will be analyzed using three tools: the tape / DOM; footprint; and candle chart. Synthesizing the three modes allows an understanding greater than the sum of its parts, giving a comprehensive understanding of the auction process. While there are many great resources out there, I am not aware of any that provide such a thorough study guide.
If you don’t have or use all of these, that’s OK. The concepts overlap, and I close out each review with a candle chart.
Moreover, these studies review the most recent price action - with the week still fresh in your mind this provides another key layer of understanding: context! What data was issued, and how did that affect volatility? What was the mood at the beginning and end of the week? What was market structure like, and were there any important earnings? Furthermore, I group analysis in a few broad categories, for example look above / below and fails (LAF, LBF - see here for the mechanics of the setup), mid morning reversals and their sister late day fades, crowded trade fails, or opening action.
My service will ultimately create a library of different market conditions and concepts. These reviews will be a powerful tool to accelerate your understanding of the auction process, thus shortcutting your journey to successful trading.
Week of August 26 Context
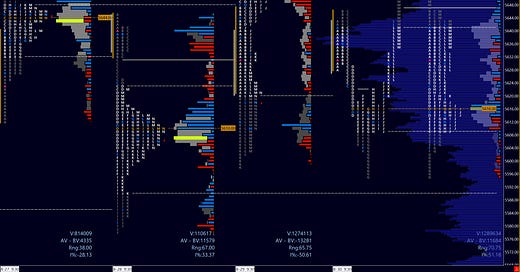
The day opened within a nine-day balance area in ES, with two-way trade - or auction - within a roughly 90 points range. Friday was tricky in that it opened on a major data point, PCE. However, this did not introduce as much volatility as expected. The day opened just below balance POC.
Bulls were initially favored as they opened above the prior day close (PDC), with the natural magnet of the prior day’s POC above. Reference Image 1 below. However by the end of initial balance (IB), it was clear that they were stalling out.
Image 1. ES TPOs
The following slides review the clues from footprint, with further analysis in a candle chart (here I use the 500 tick). I encourage you to review the tape / DOM as well at these locations on your own time.
Analysis of a Poor High
Instead of going into exhaustive detail at every price level or delta imbalance on a footprint, it is good practice to use the it as a narrative tool of the auction process, identifying transitions between momentum, absorption, exhaustion, and counter-auction. Overcomplicating leads to indecision which leads to missed opportunities, or much worse, inopportune and sloppy entries requiring a much larger risk and leading to an inversely proportionate win rate.
The latter are recognizable consequences of FOMO (fear of missing out).
Footprint charts may look intimidating at first glance, as they are a record of every transaction on both the bid and the ask within a timeframe. Consider it an ‘x-ray’ of each candle, allowing you to view the auction taking place within. Much like candles are a record of price over time, the footprint is a record of orders over time that make the candle.
Does a footprint give you an edge in trading? Not necessarily, like any tool it’s a matter of how well you can use it. Just because I give you a sous-vide does not mean you’ll be making a Michelin star meal for us tomorrow.
What it can do is give you another layer of information, and that can be more power to you. For this footprint primer, observe the stages of the auction below and what the intensity of delta tells you regarding the price action and relative strength of participants. Let’s use it to tell a story.
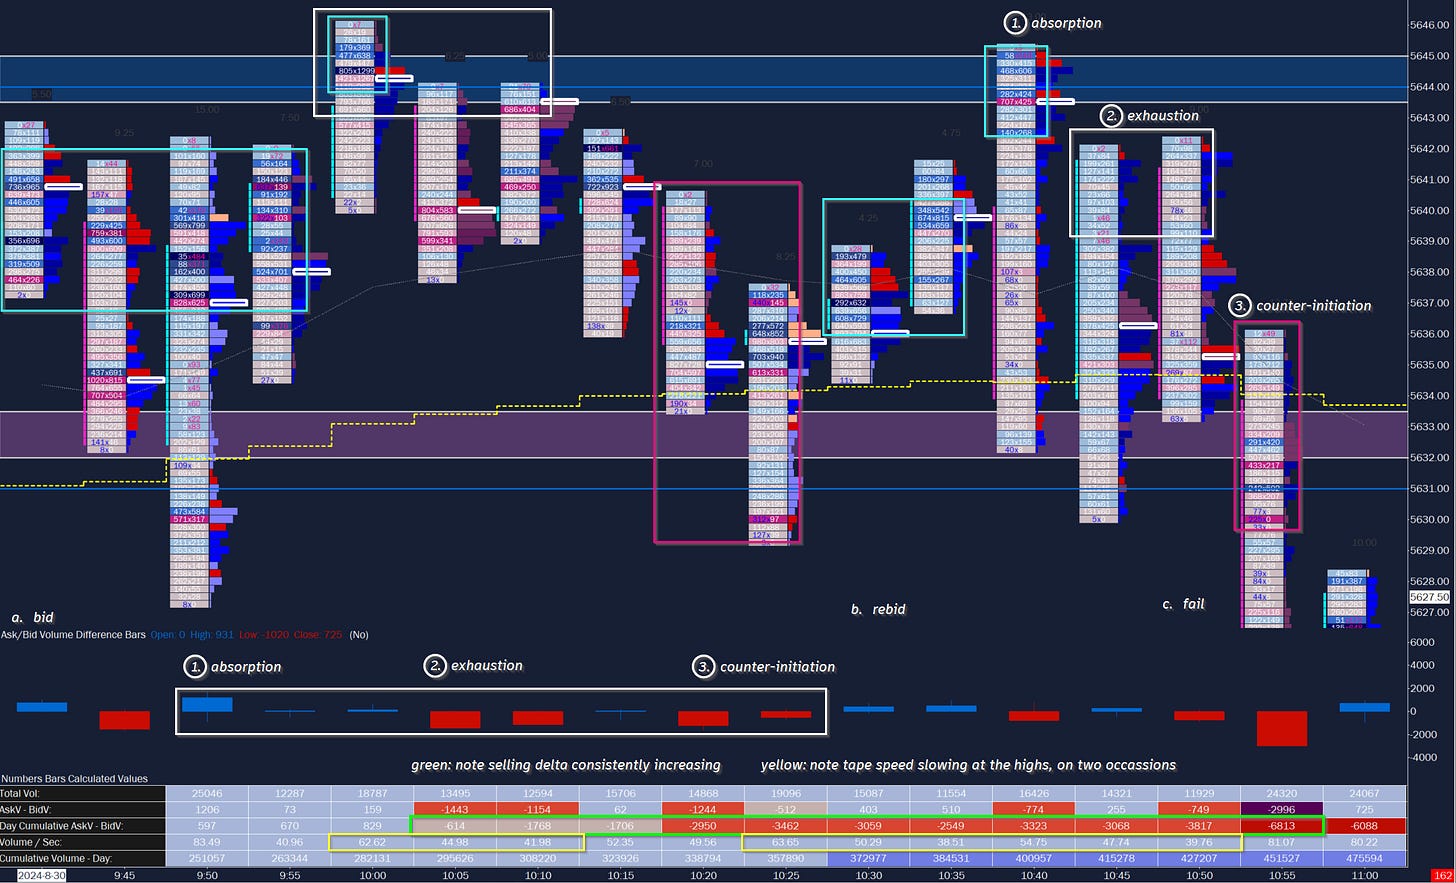
Image 2. ES footprint; 5m candles
a. The bid. Buyers are still present into the close of A period as they target balance VAH (from our weekly context). However for all their buying they are not necessarily being rewarded for the effort: price is barely moving up. Simultaneously note the presence of large sellers evident at 9h45-9h50EST, which is quickly rebid all the same.
The B period (10h00EST) opens with a pop above this area of absorption. But this is quickly sold into as volume does not follow through with price. Passive selling (earlier absorption of heavy blue delta) turns into responsive selling (selling into the bid, manifesting as red delta candles) - buyers are slipping, and one more effort at 10h15EST sees absorption make a lower high. This attracts more selling as buyer exhaustion leads to seller initiation.
Note the second set of heavy red delta bars.
*If you were a savvy risk taker at the highs, you may have noticed the lack of follow through buying into A period, then joined as a seller into the bid, with stop at the highs. A sell into bid on seller initiation around 10h20EST could also be valid, although requiring a higher stop.
b. The rebid. Hold on, maybe there is hope for buyers yet for new highs! We’ve certainly all heard this playing in our head as the bid slips lower with each candle, hoping that the passage of time might somehow come to save my trade now underwater. And it was certainly playing in theirs at this time.
I generally avoid taking a position just ahead of a period rollover. This time into C period, as the first few minutes - or even seconds - of trade in the period open set the tone, sometimes taking the form of a reversal. Now we see why a higher stop for trade chasers is necessary.
And indeed, buyers give another effort, attracted by what they seem to perceive as ‘good’ prices at a key level that week, 5630. Sellers step aside and many late or wek shorts are stopped out. Notice something curious, though - volume tapers off very quickly from 10h30 to 10h35EST, something you do not want to see for follow through in momentum. This rebid got off to a promising start but fizzled.
The heavy blue delta on the way up into 5640 is indicative of passive sellers once again, as price painfully ticks up with each passing minute. This is absorption on the way up. One last hurrah at 10h40EST is an attempted initiation into new highs. Buyers dead end three ticks from the high before sellers pile in. Now note the candle close at the lows! Buying is mostly exhausted. We have likely formed a poor high - indicative of weak buyers - and an incomplete auction which may be revisited later.
*This 10h40EST candle would be a GREAT example to review on the tape / DOM: at 1x speed, please!
Yet again there is a tepid rebid; note how speed (vol/sec) has been gradually falling off. At this time there is no heavy blue delta left even as we reclaim the prior 10h40EST candle open. Volume again dries up from 16k/5m to 11k/5m; passive selling turns responsive. Sellers counter-initiate to a break of balance lows at 10h55 and into a steep sell in D period.
Within larger context of absorption (A period), exhaustion (B period), and counter-initiation (C period), there are fractal instances of absorption, exhaustion, and counter-initiation… For example, B period called out above. You may even discover these sequences within each candle as well.
These are the rhythms that make up the auction process. The footprint is just one method of examining them. Now take a look to the action on a candle chart.
Longer-term followers will recall that I stress the importance of identifying auctions on our charts, be it the 500 or 1000 tick, the 1m, or the 1y timeframe. These are areas of balance where participants agree on a certain price. In other words, two-way trade is taking place. A break of this balance means that participants no longer agree to this price and embark on a search for value elsewhere. This typically happens as volume dries up; the market is then forced to search for areas of higher available liquidity.
This search takes the form of an imbalance, either into uncharted territory, or more often, an area of prior agreement (balance). This is why is it critical to understand what these zones are and how to identify them. Being disciplined and accurate in your assessment will allow better entries and thus risk management.
Image 3. ES 500 contract tick chart
Examining the chart in Image 3 above which overlaps the footprint we studied earlier, note that I have drawn out an auction from the zone of two-way trade at the highs. The quick and easy way to do this is to eyeball what prices host the highest number of opens/wicks/closes and draw out a box from there (hint: the candle action usually forms the shape of a box for you).
Note the absorption just below the auction box making progressively lower lows and lower highs. Buyers are clearly on the backfoot. While it is entirely legitimate to short the lows of the auction box, depending on your risk parameters or conviction, be aware that the period rollover could easily spike in either direction, potentially taking out your stop above the highs.
Sellers didn’t get this memo from us and instead initiate before period rollover. Rather than chase with them it is prudent to wait into C period for the reasons described above. So note the rebid into the auction lows. Prices moving back into the auction box may have scared out a lot of earlier shorts, and this is entirely the point - the liquidity grab from weak hands. But with no more demand to push aside the remainder of the sellers, price drops below the auction once again, never having reached the high bound of the box.
You now understand why a stop on the other side of the auction (above the high) would have been prudent. And this, too, is why we draw boxes - to visualize and calculate the amount of risk we need to take on.
Of course, fakeouts could take out your stops anyway. While the aggressive trader would have been protected with a stop above the box in this instance, note that even a conservative trader would have had another opportunity to join later (or add for the confident trader). This time there was no excuse - originally prices failed to maintain the auction on reentry, now on this next retest at 10h50EST, price fails to even violate the lower bound.
This is an A+ setup for the shorts.
Like the lesson so far? Great, there’s more for subscribers. Not just in this lesson, but on a weekly basis. Scroll down to analyze the day’s low… the big money-maker: a late day fade closing the day nearly 60 points higher.


