
Footprint Course: Counter-Initiation Lesson I
February 28, S&P500 (ES)
Each week I review key moments from recent price action in the indices. These instances will be analyzed using three methods: the tape / DOM; footprint; and candle chart. Synthesizing the three allows an understanding greater than the sum of its parts, leading to a complete understanding of the auction process. While there are many great resources out there, I am not aware of any that provide such a comprehensive study guide.
Image 1. Wile E. Coyote, Warner Bros. Merrie Melodies (1949)

Too Far, Too Fast
Another deeper dive into footprint charts. In this series we explore the three primary concepts revealed using this tool with regard to ‘turnarounds’ in the price action: absorption, exhaustion, and counter-initiation.
I had nearly a dozen requests into Saturday to review the turnaround in the market into Friday afternoon. I knew they were coming!
On the other hand, did I know the turnaround was coming? We never do, in fact. However, the market was already showing heavy hints that sellers had run a little too far. Just like buyers had run out of steam the week before (and where I placed a hedge with March puts).
I even had a follower mention they were buying calls mid-week, to which I replied ‘not yet’. Because the turnaround simply did not have any logical argument at that time. So what are those arguments generally? We’ll examine some in the footprint below, for intraday traders. But these concepts apply to all timeframes. Yes, they could have been right and got in exactly at the right time. Trading with probability, however - I did not see enough of previous patterns built up from more than a decade of watching the tape.
Image 2. Always another train.

Who cares about exactly the ‘right’ time however. Right is whatever works for you and your statistical model. First rule for saving money though - let others find the bottom for you. We have some great examples below.
Counter-Initiation
In the last couple of lessons, we did a closer examination of the ‘look’ of absorption. During periods of extreme price discovery / volatility, the fast price action often leaves a ‘vacuum’ of trade as more conservative traders step aside.
This is exactly where you do not want to come in to support the market.
Even with a clear reference with which to lean against, the momentum is simply too strong - price will often cut though prior levels. It is far better to wait for signs of absorption and exhaustion first before engaging a trade.
But as so many followers asked for analysis on Friday, I’ll jump ahead a bit. Absorption is also less likely to take place during high volatility days, simply as the opposite side of the trade steps into the vacuum there is little to stand in the way. Often price will revert violently.
This is where real money is made in 0dtes. This is not a common trade. Options traders learn this the hard way.
Image 3. Information contained in delta and volume
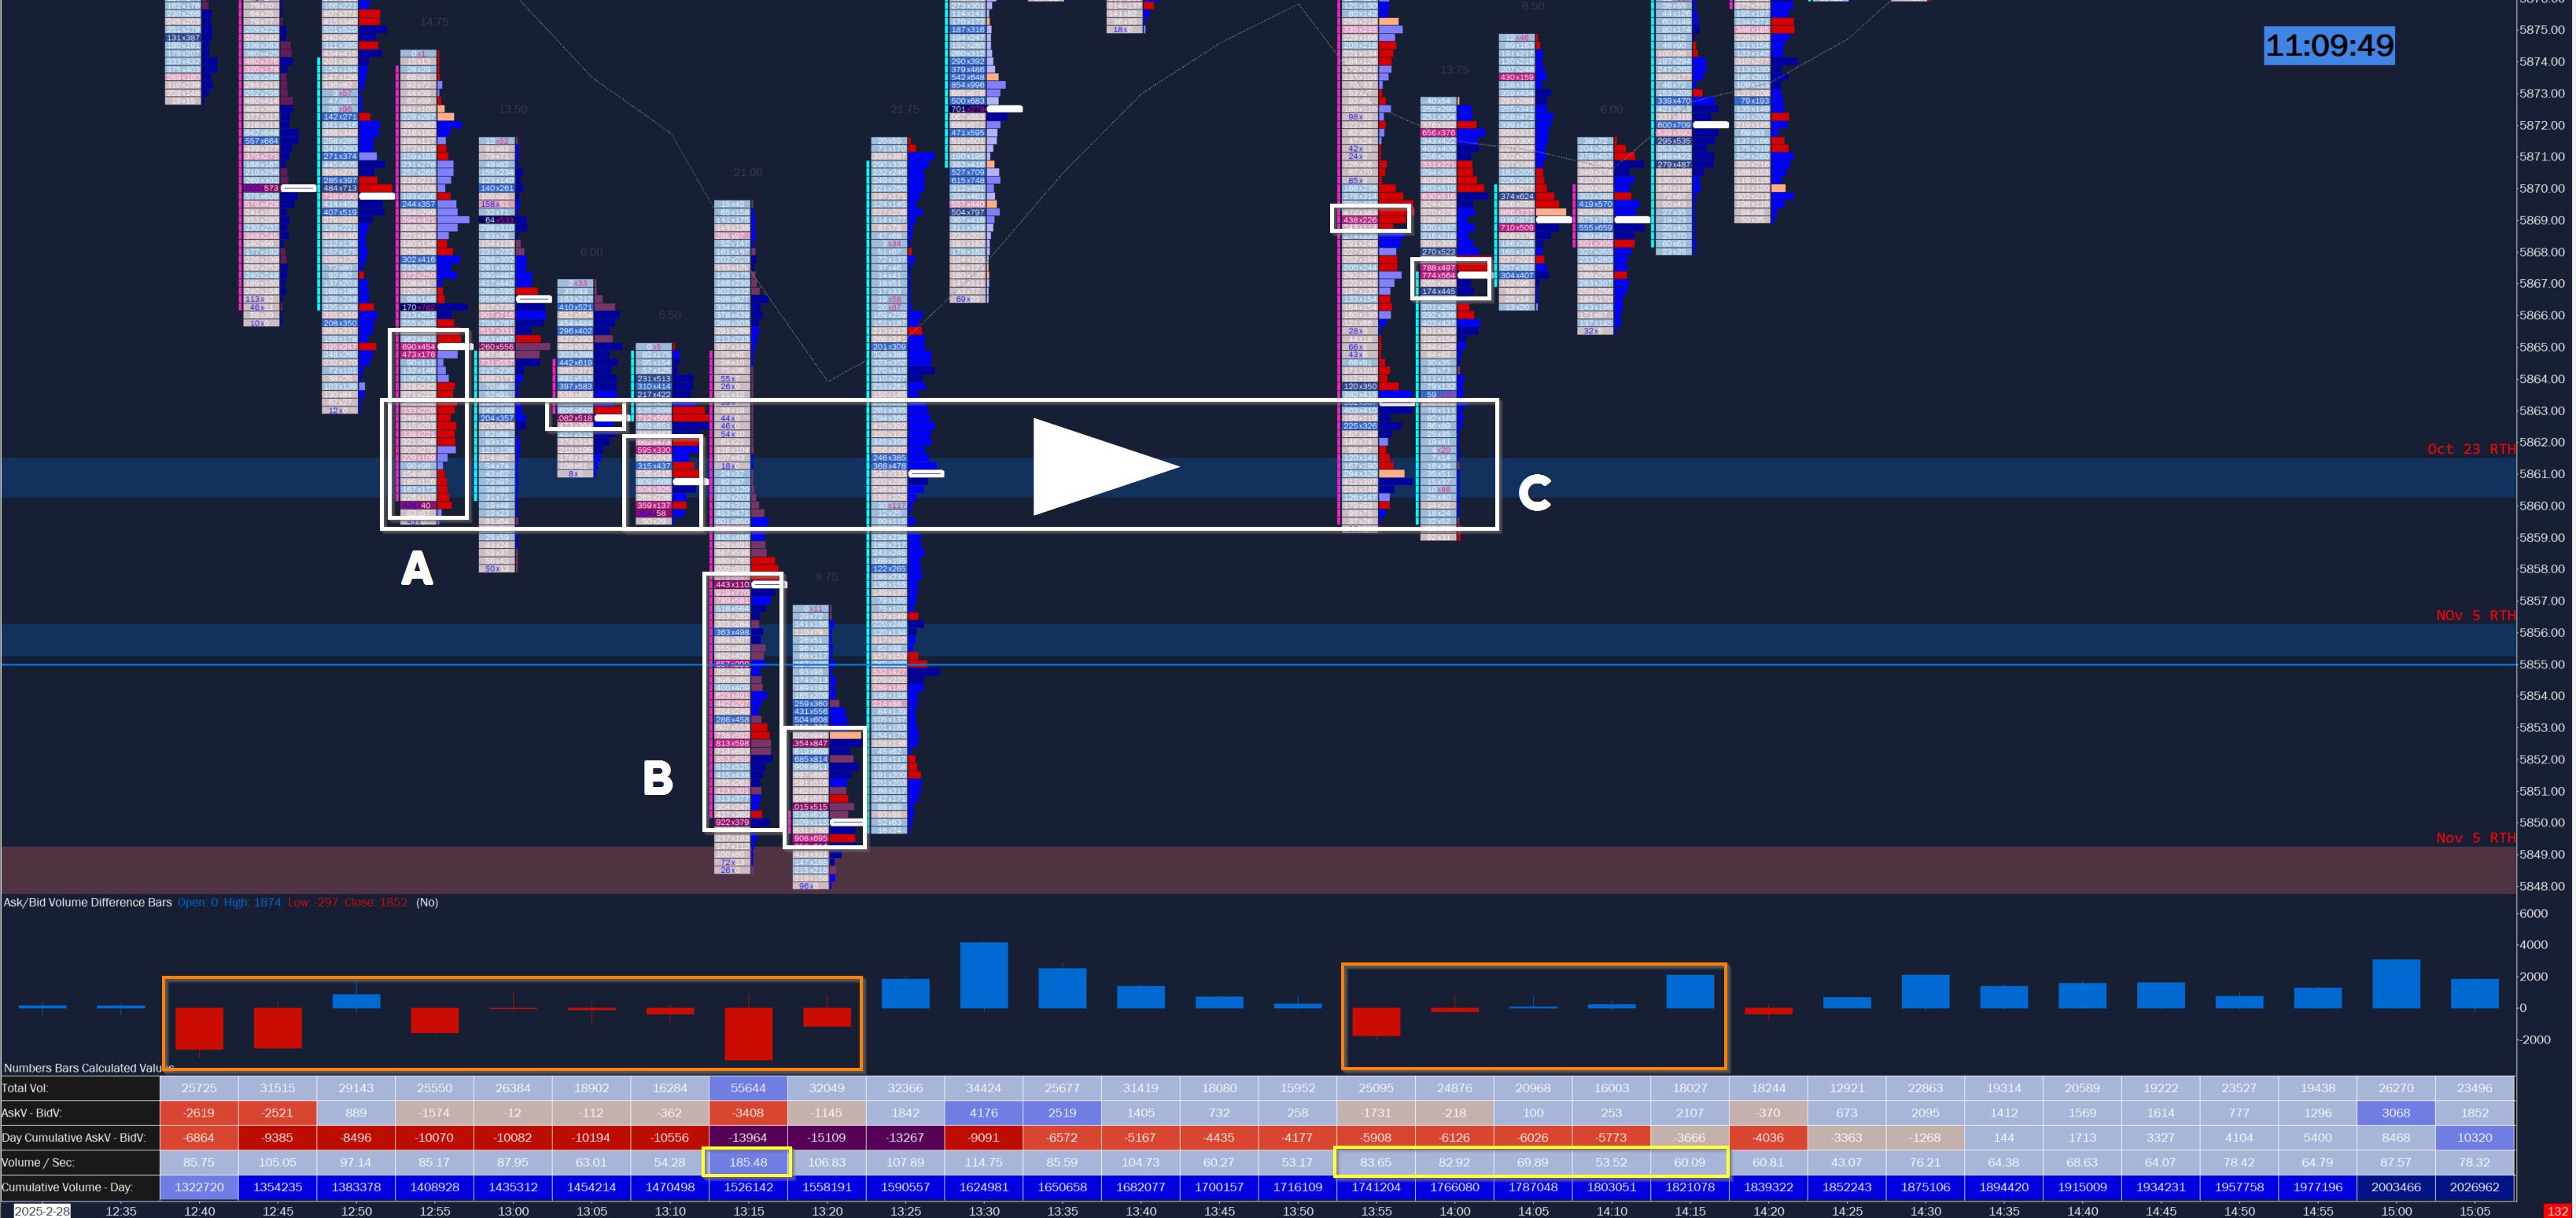
A. Price is moving quickly, and large sell orders are visible on the footprint as dark red areas. These remain consistent on the way down, indicating sellers are still very active. Note the heavy sell delta. The short break at 13h00 in selling delta takes back up again at 13h15. Initially it looked like the possible start to a bid at 13h10 - note the strong blue hits into the offer, as well as trade volume slowing down. But is that different than the larger buy orders previously? Has delta by volume flipped (see orange highlight)?
I would wait.