
Footprint Course: Absorption Lesson I
February 2, S&P500 (ES)
Each week I review key moments from recent price action in the indices. These instances will be analyzed using three methods: the tape / DOM; footprint; and candle chart. Synthesizing the three allows an understanding greater than the sum of its parts, leading to a complete understanding of the auction process. While there are many great resources out there, I am not aware of any that provide such a comprehensive study guide.
A Brief Introduction to the Footprint
This week I begin a deeper dive into footprint charts. We will explore the three primary concepts revealed using this tool with regard to ‘turnarounds’ in the price action: absorption, exhaustion, and counter-initiation.
For those new to footprint charts, my color settings indicate order flow delta. That is the difference between trades into the bid and offer at a specific price. The darker the color, the higher the delta. My settings may be different than yours, I have simply identified the deltas that work for me and my product, ES.
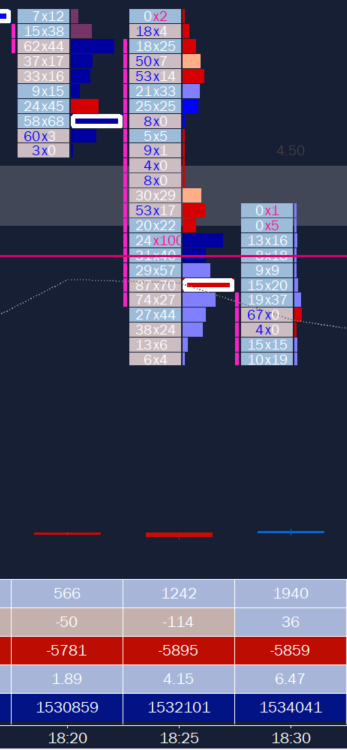
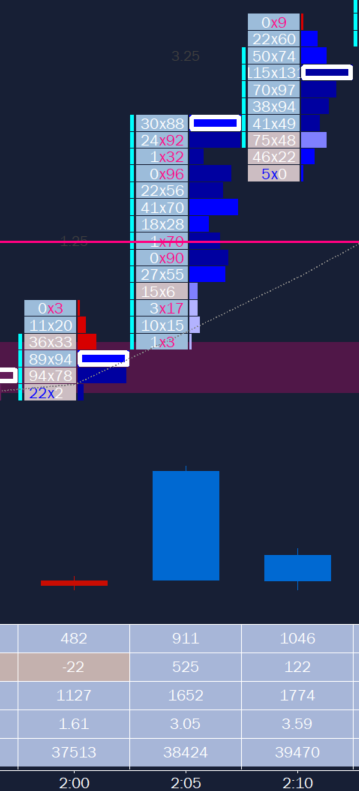
My number text automatically highlights for exhaustion prints, below are two examples of exhaustion prints into the offer and the bid. These are prices which trade few, if any, contracts on the opposite side of the book at a specific price. This will be identified by ‘N x 0’ or ‘2 x N’ for example. This indicates the lack of any further marginal sellers or buyers at that price.
Images 1-2. Exhaustion at the offer; exhaustion prints at the bid
Identifying Absorption on the Footprint
Image 3. Areas of absorption
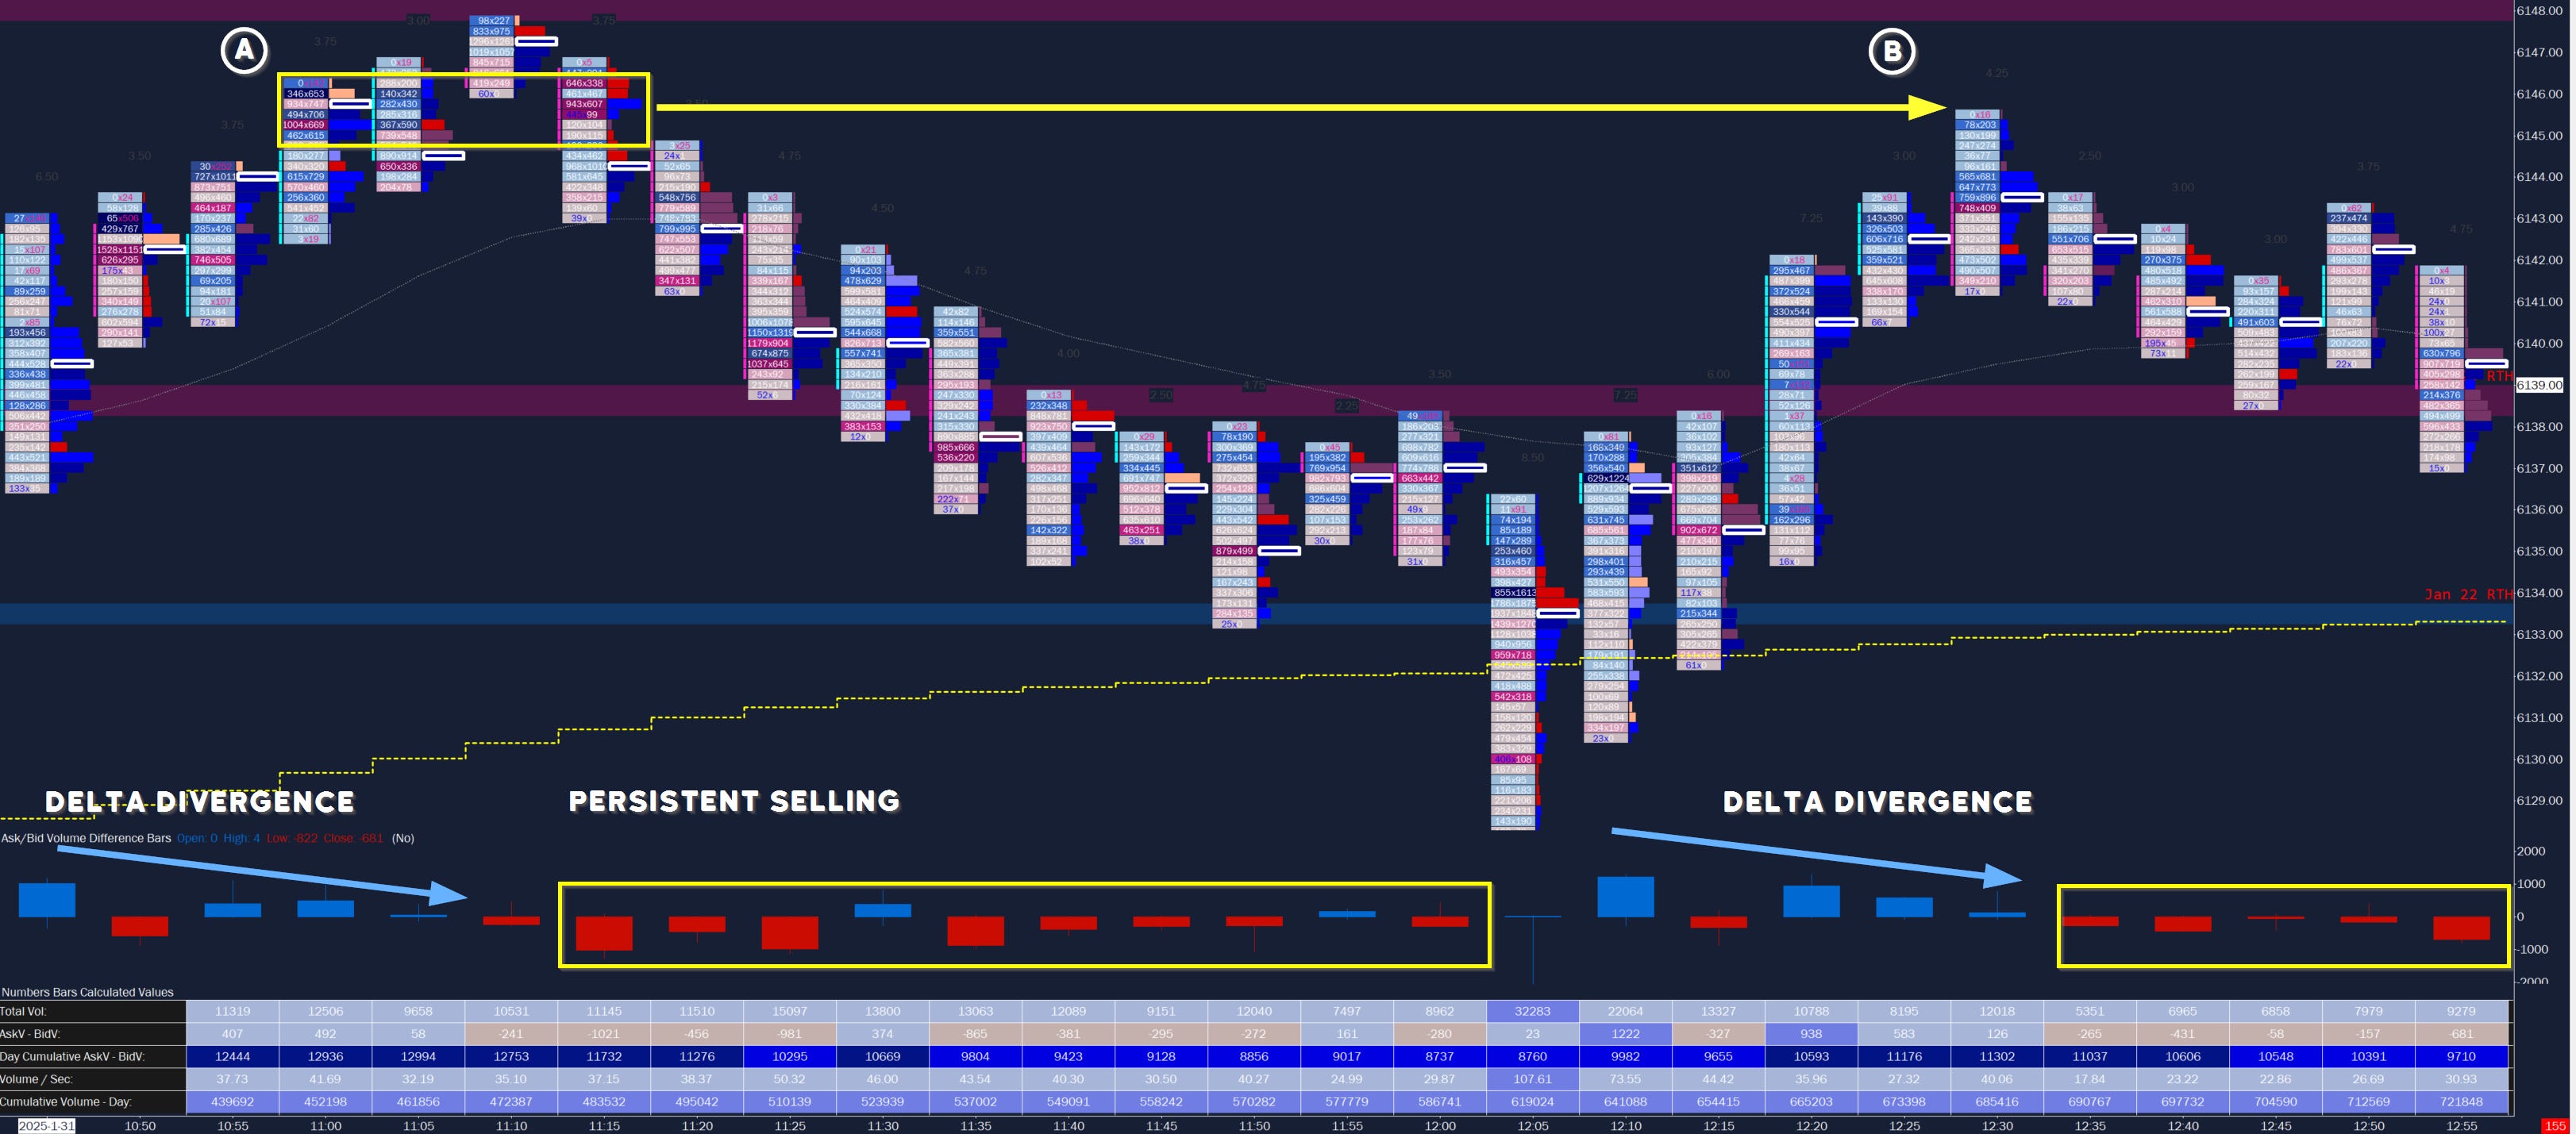
A. In this area I noted the high delta into the offer (heavy blue) and subsequently into the offer (dark reds). I typically draw out a liquidity band going forward from this area. I have not done that in this set of charts as I was watching a prior liquidity area above.
You can see that we hit it to the tick!
Nonetheless we will use an arrow in this example. This is how I might draw it. Don’t fuss over the exact tick - it is to identify the price at which a larger player is selling (in this case) or buying).
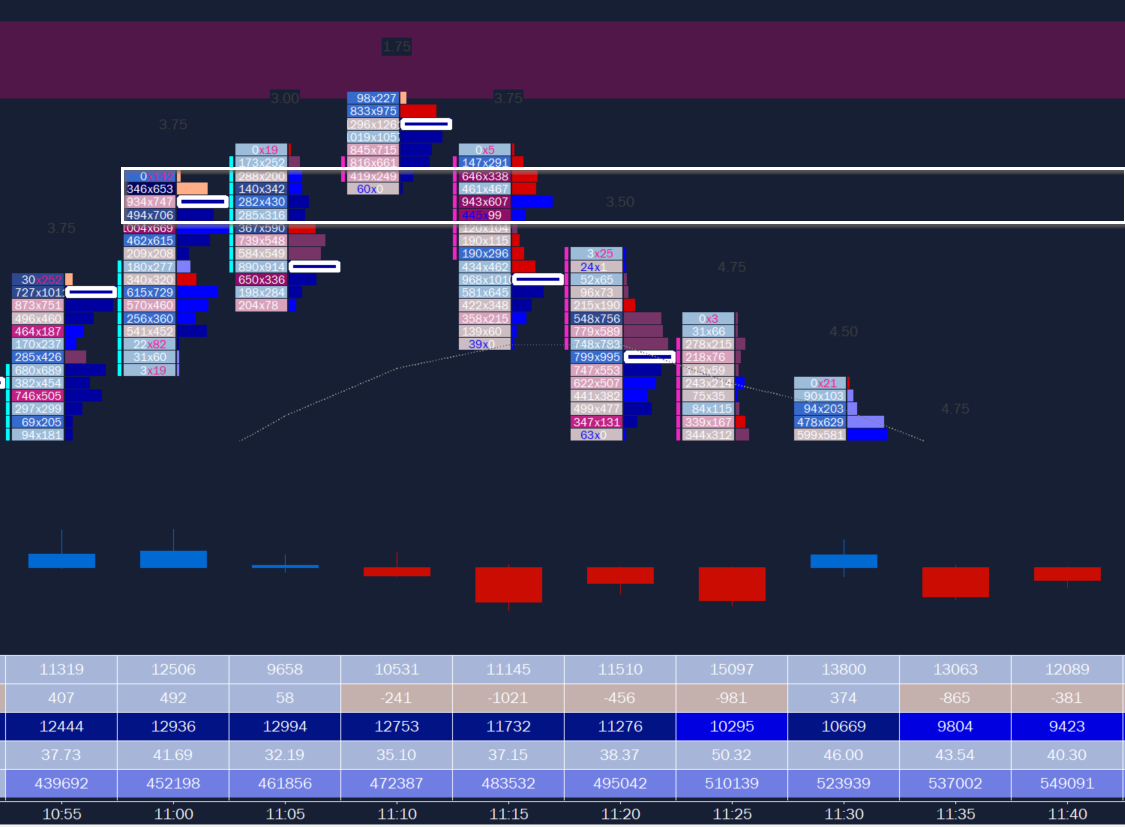
Image 4. Area A callout
The theoretical aspect is the initial absorption into the offer (right side of the tape or footprint) by a large passive seller, then into bid into a large responsive sell into the bid (left side of the tape / footprint). Effectively it takes a lot of energy in the form of contracts to move the price by one tick. This is not your small chat group sitting on the offer!
Large players will often sit at a location (which is sometimes visible in the depth of market, or DOM, for level 2 data) waiting to unload (or accumulate) inventory. Once most of the order is filled, they will continue to actively sell into the bid as price trades around this location in the book. Once most of the order is filled, players will unload the rest of the it into the bid as they (or their algo) notice market orders coming in at a price - in sufficient enough quantity to take the remainder of the order, giving the best possible price.