
Five Easy Tapes: Open-Rejection Reverse
Crow Call: July 7th
Each week I review key moments from recent price action in the indices. These instances will be analyzed using three methods: the tape / DOM; footprint; and candle chart. Synthesizing the three allows an understanding greater than the sum of its parts, leading to a complete understanding of the auction process. There are many great resources out there, although I am not aware of any that provide such a comprehensive study guide.
Image 1. Prayers answered. Bears

Live Tape
In this and coming examples I will share my screen with the tape and footprint during live trading sessions. Not all of these worked out, the key is to understand what is going on during the session, as well as appreciate when things suddenly change - or your reading was off.
Piece No. 3: the Open-Rejection Reverse
I decided against posting an older trade and went with today’s live trading instead. It’s a good example of me getting the read wrong initially (why I went against my premarket plan I can’t explain), closing a position at next to no loss - and reversing direction.
It’s a great example of an open-rejection reverse, where initial strength reverses course and gains strength in the opposite direction, typically within the first period (30 minutes). On a larger timeframe, it’s often the beginning of a larger balance or cyclical reversal.
July 7, Quick Thinking
Below are two videos at 1x speed. The first is me joining what looked like initial strength, but as soon as I saw aggressive selling on the tape I had reservations. My ‘feeler’ position was only that.
I often like to tease a small position to a) show commitment to an idea; but b) not risk a bias if I go in too deep.
Video 1. ES tape / 5m footprint. Long trade entry and flatten
INITIAL SETUP: Open test drive against the prior day low. I was looking at Thursday’s range, given that Friday was a holiday.
THESIS: Dip buyers stepping in post-holiday, at least for a test of the prior day value above, where I expected resistance to come in (and possible a short opportunity). Other than that, a fail of 6300 would see more downside.
Image 2. ES profiles, July 3, 4 and 7
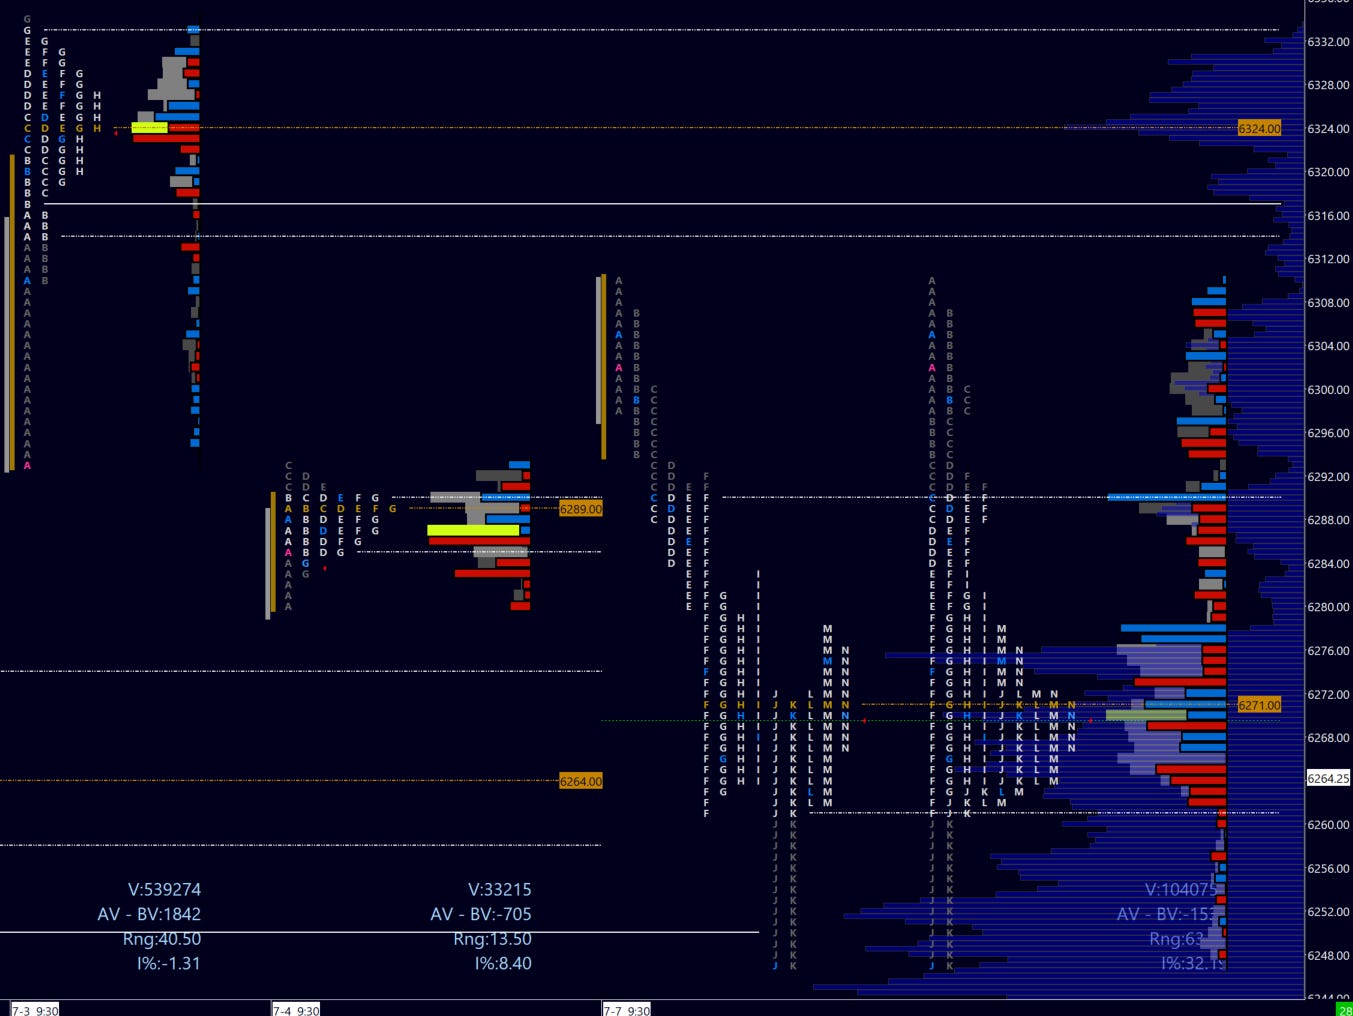
OBSERVATIONS:
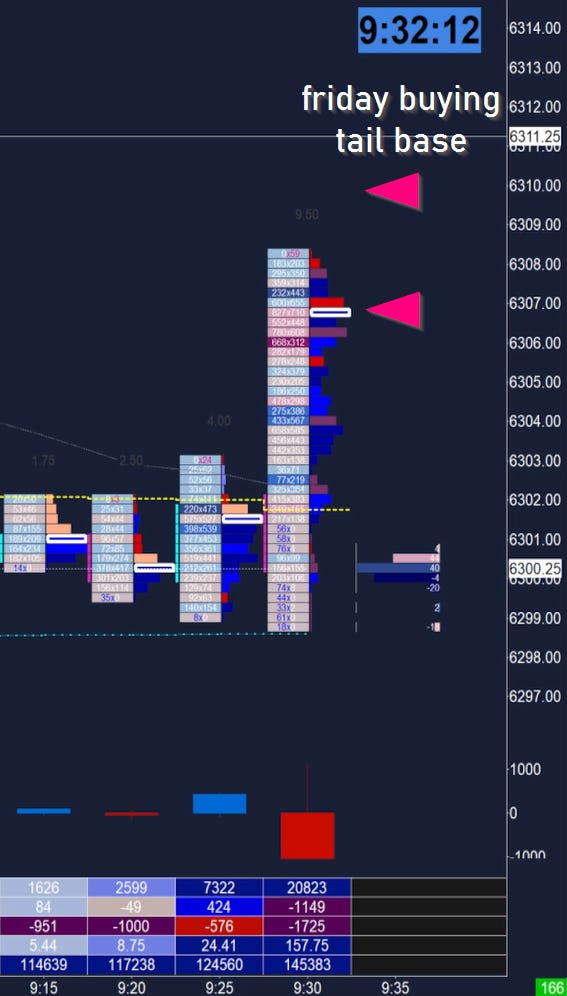
9h30:00 The bid was arguably strong at the open, with heavy blue delta suggesting an inventory correction from the pre-market selling in addition to new buying. I typically wait out the first five minutes but this seemed like it could have legs. My mistake was not respecting the fact that the lack of initiative above Friday’s buying tail base (6309) suggested strong passive selling.
9h31:10 The sudden large hit into the bid made me question my thesis, however I had my fill at this point so I was on high alert for signs of seller continuation. The aggression at 9h31:40 seemed like a waterfall was in the works so I quickly flattened.
9h32:00 Sellers are showing clear intent. It is at this point that I change my mind on the likely direction in the morning, and begin assessing a possible short entry. In my mind, that looked something like this, the developing POC of the 5m opening candle and the buying tail base from Thursday further above.
Image 3. ES 5m developing opening candle
The key to understanding this is that I already had the thesis in place before the market opened. I did my homework - shared it! - and was ready for possible outcomes. I had simply set my gut feeling for a short aside at the open. Which was fair, the buying seemed initially strong.
But I’m not stubborn enough that I can’t change my mind twice.
9h34:00 I initially set a feeler around the LVN6305, also where I tried my original long. The opening candle closed on 6300, which is extremely indecisive. But overall weak given the rejection of the opening push!
NEW SETUP: Open-Rejection Reverse!
Let’s skip ahead a little and see how that played out (and how I traded it):