
Feb 8, ES Plan and Missal: Braces
Old friends.
Image 1. Gaps that charm. Terry Thomas, 1965

An unfilled gap can have quite the powerful screen presence. This happened on Wednesday as sellers’ lack of appetite to fill the gap saw buyers step in, bringing prices above our 5,000 psychological mark. A couple of closes above will act as a ‘gate’ to higher prices. Sellers remain largely out of the picture despite inventory unloaded at favorable prices. The key now is to that gate is knowing if this was new business, or old business closing positions.
Minister’s Missal
Today’s plan was solid as we landed exactly one point shy of my final target (and this may very well be achieved after-hours). Not only did we open well above pivot, we opened on a large gap at our 4995 level of interest. An initial look above saw some failure but found support exactly at the overnight VVAH. This was personally a level I did not mark down. This means that I preferred a retest of 5,000 from above, which sellers attempted three times.
Image 2. Wednesday’s plan from my feed
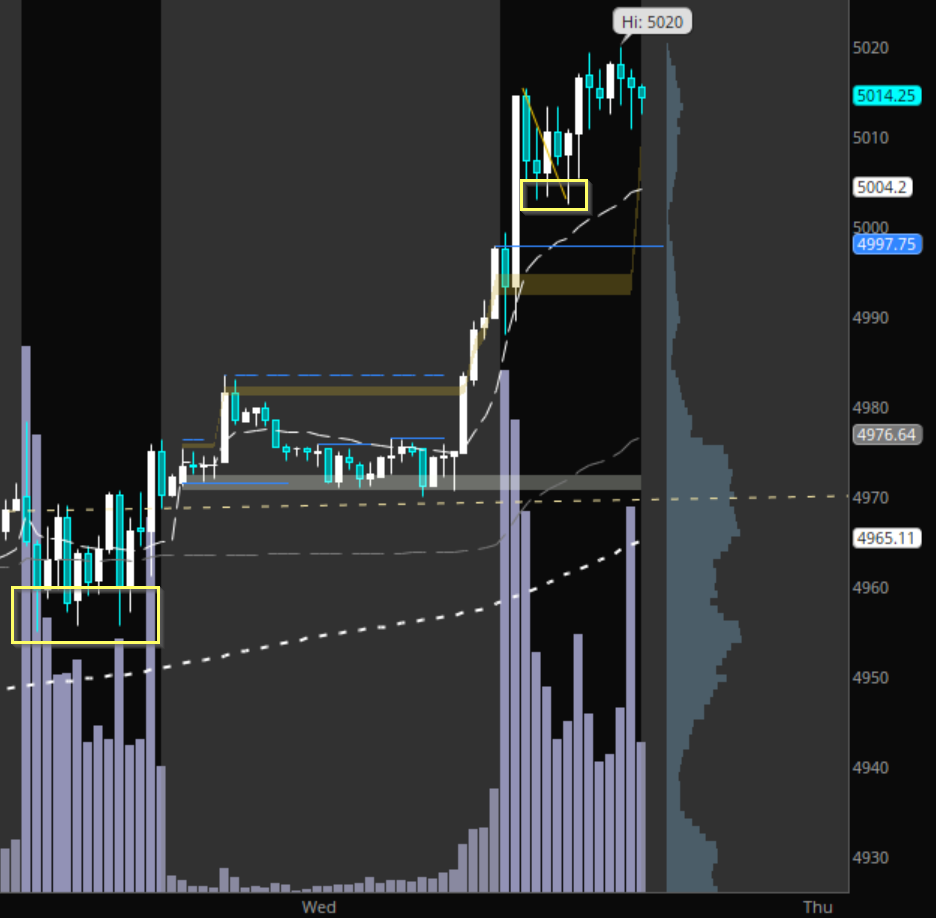
These intraday poor lows/highs are actually very important clues. They reveal the inability of one side to initiate, while trapping traders aiming for a break. These late shorts/longs are then forced to cover when the trades moves against them. Similarly to Tuesday’s intraday weak low in B, F, and J periods, Wednesday formed a poor low at D, E, and G. On the surface this seems like an intimidating place to go long, but with stops just under 5,000 in today’s session - or the day’s low on Tuesday - the risk to reward can be favorable.
Image 3. Tuesday and Wednesday intraday poor lows
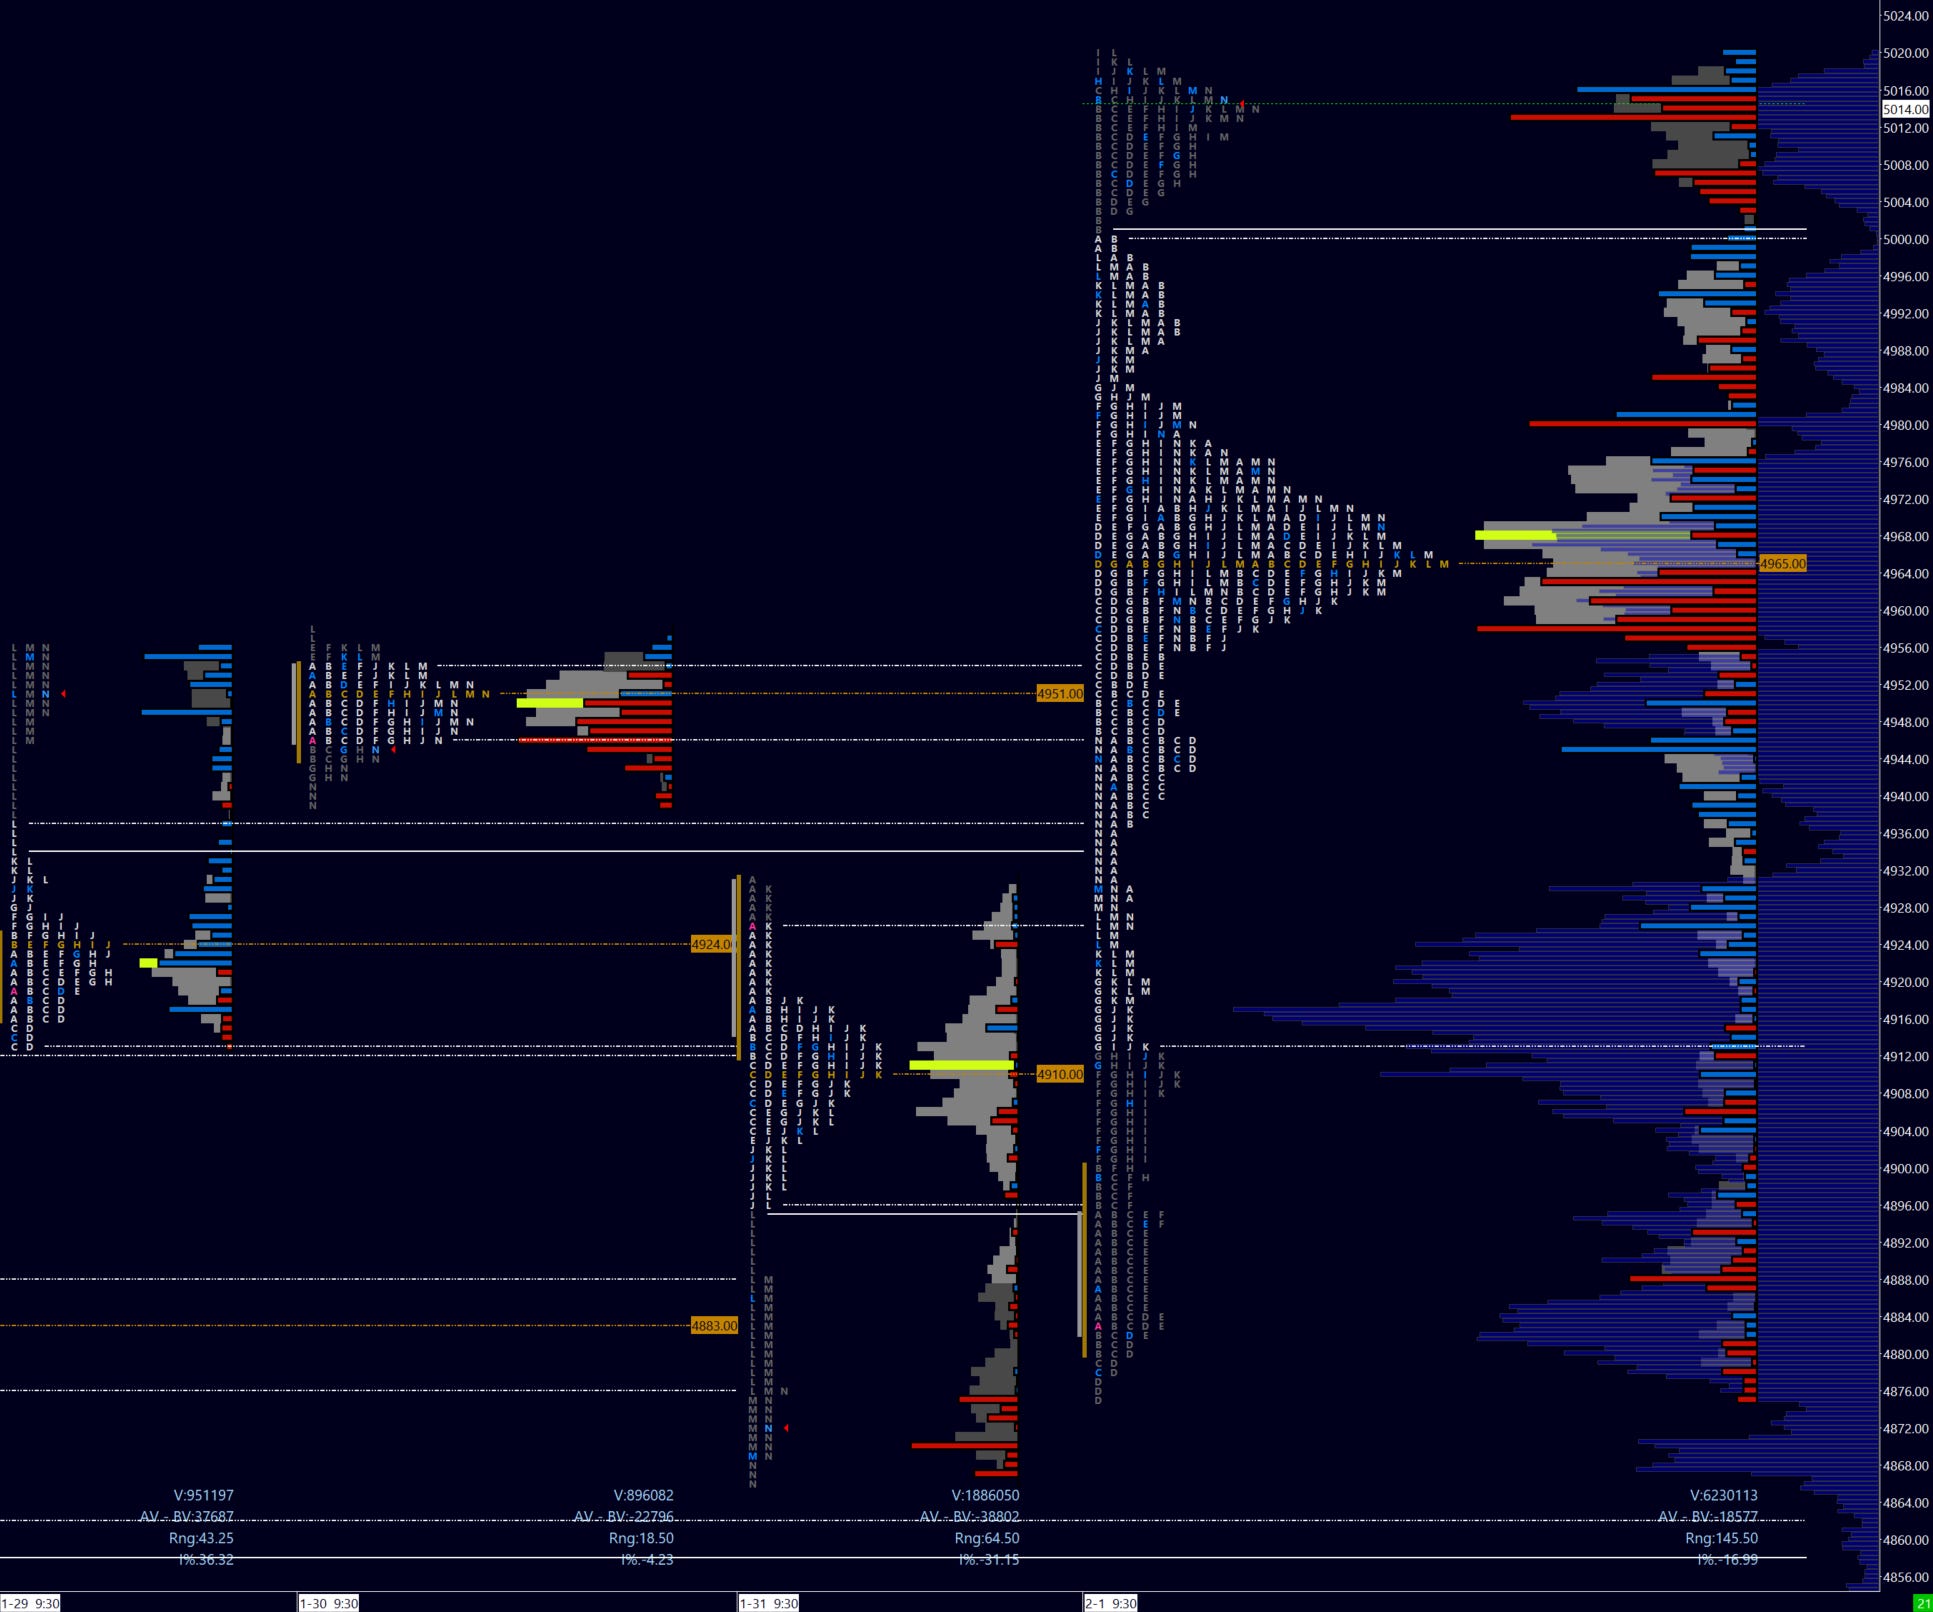
The day resulted in a ‘p’ shape indicative of buyer absorption. At the same time we managed to find acceptance above the psychological 5k level. The SPX stopped less than a point away from its corresponding 5k mark. Buyers will ultimately be looking to establish short-term (5D) value above 5k for higher targets, but this may yet be a few sessions away. Sellers meanwhile need a strong close returning prices below 5k - also the 5D VAH - and below value at 4965 to negate the breakout.
Image 3. Short-term (5D) profile
Thursday Plan and Levels
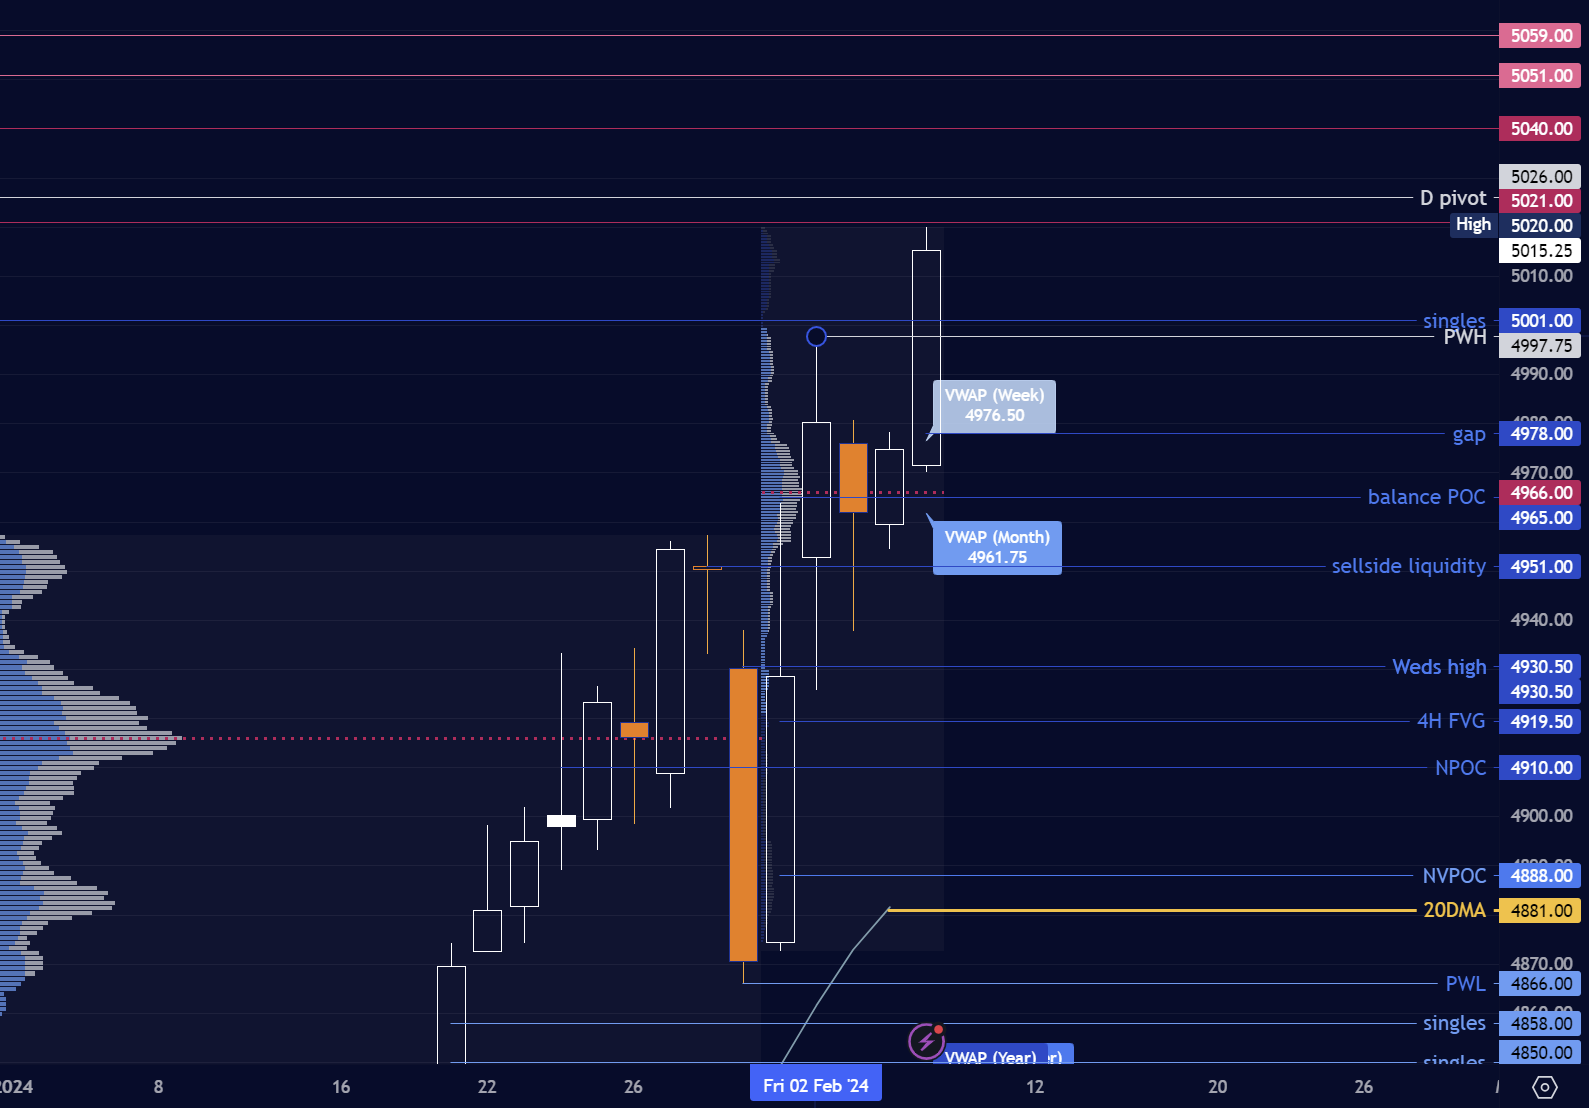
I will use 5026 as a pivot into tomorrow’s session for higher prices. This is a symmetrical number off of Wednesday’s POC. A secondary pivot would be 4998, or the recent break of balance. As of writing I lean toward a balanced session, with a lean short if the pivot is defended.
a) Buyers leaning on 5010 target an hourly close above the pivot. This opens weekly target 5040 to 5051 where sellers may step in. A further target can be 5059.
Buyers LIS 4998.
b) Sellers defending the pivot have as an immediate task an hourly close below 5,000. Next up would be a gap fill at 4978, followed by NPOC / 5D value 4965 where stronger buyers are likely to step in. Any momentum could also target 4955.
c) Sellers need to have VIX recover above 13.40 for meaningful downside, conversely buyers can see momentum with VIX below 12.54. NVDA is finally over 700 which can support the indices into higher targets as well. AAPL has been relatively quiet however a hold of 190 can add to bullish momentum, conversely a loss of 188 can put a temporary check on long indices. The TSLA 187.50 level remains a valid support into the next target 192. In NQ, 17850 can act as a pivot going forward.
Image 3. 4H TF, Critical ES levels
Tip jar - support my continued work!

Your support and comments are appreciated. I do my best to respond to everyone in a timely way. Be sure to follow me @rareverend on X (Twitter) for the latest updates!
Don’t maintain bias in the face of contradicting information! Capital preservation is key.
This is CERTAINLY not investment advice and I am not a qualified licensed investment advisor nor a minister of the church. All information found here, including any opinions, commentaries, jokes, outright mistakes, and suggestions - expressed or implied herein - are for informational, entertainment or educational purposes only and should not be construed as personal investment advice. While the information provided is believed to be as accurate a picture of trade as I see it, it is after all how I see it and errors or inaccuracies are practically expected. I will not and cannot be held liable for any actions you take as a result of anything you read here. As always, conduct your own due diligence, or consult a licensed financial advisor or broker before making any and all investment decisions. Any investments, trades, speculations, or decisions made on the basis of any information found on this site, expressed or implied herein, are committed at your own risk, financial or otherwise.