
Feb 21, ES Plan and Missal: The Top 5.5%
Discount pricing.
Image 1. NVDA CEO Jensen Huang.

The title is a reference to NVDA’s market cap as a percent of the NASDAQ index. Even after a recent sell off it’s still larger than the combined GDP of Spain and Portugal.
If you think that’s ridiculous, it is.
That doesn’t mean the stock is overpriced, that’s a function of whatever buyers are willing to pay for it, and sellers what they will sell for it. But what is for sure is that the stock (and just a handful of others) have an outsized impact on the indices. In covering data events this week in the Weekly Outlook, I overlooked to mention NVDA earnings Wednesday. Was the market ‘front running’ a potential selloff with a slight correction on Tuesday?
Minister’s Missal
My Tuesday premarket B scenario was spot on, so I won’t cover in detail what I posted in my feed this morning. In sum: context is king. Buyers failed to close the gap at open after a correction of net short overnight inventory, and sellers stepped in exactly at the ETH VAH. These exacting references are once again indicative of very short-term traders. We then proceeded to my two main lower targets, finding bids a few points below my ‘gate’ 4972 (a prior NPOC).
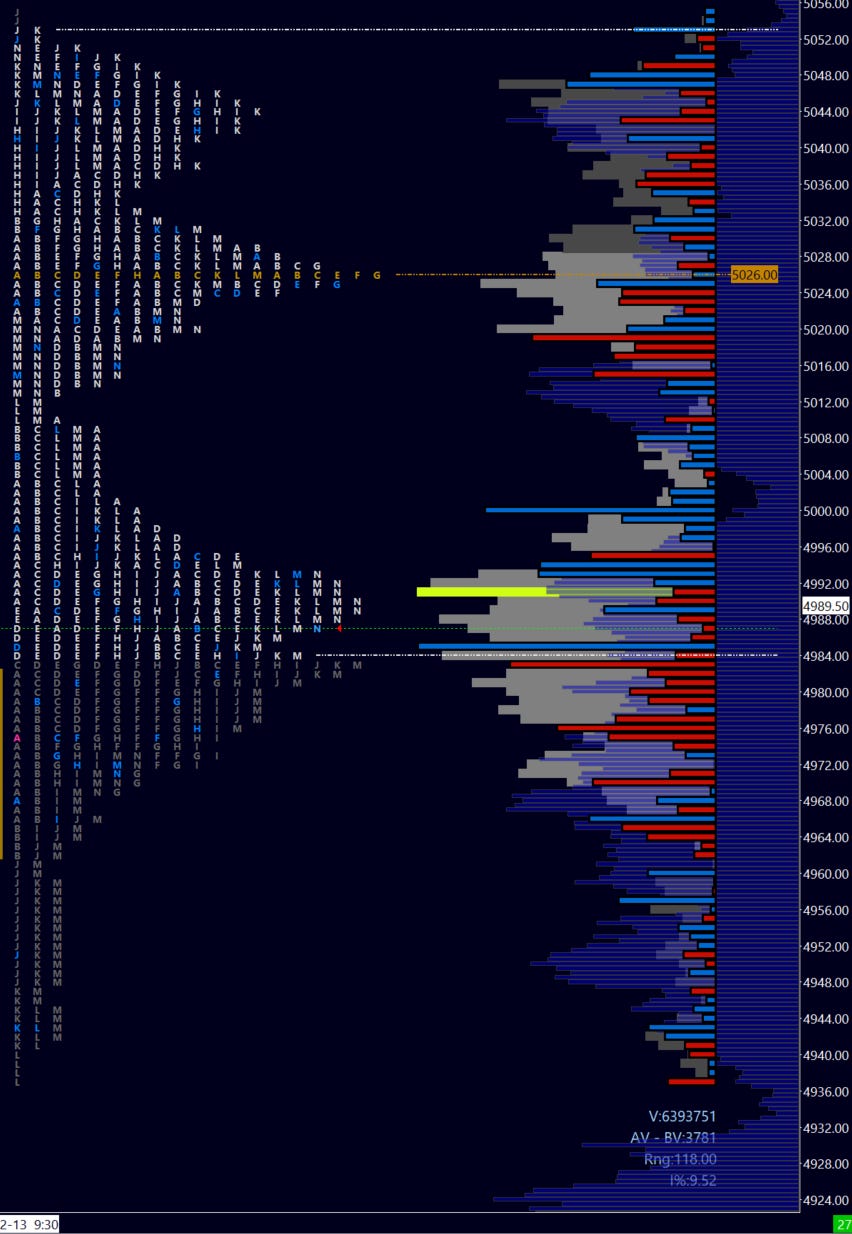
Image 2. Thursday low at RTH VWAP SD2
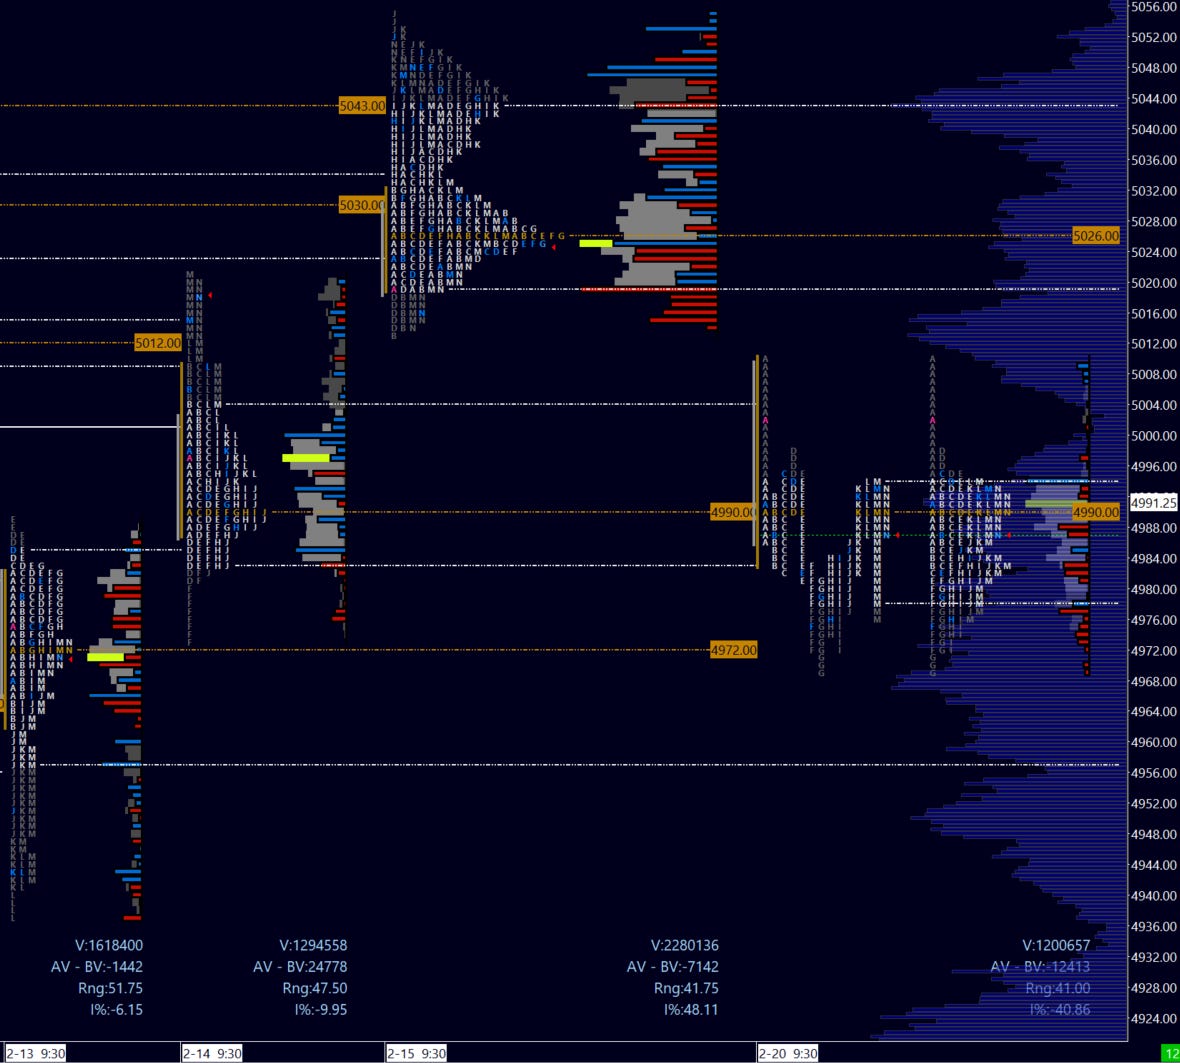
Buyers then corrected into close following a renewed initiative attempt by sellers in M period, closing the day near VAH (but near daily balance VAL). The action left a ‘b’ shape profile indicative of absorption however sellers took a lot of inventory home. The weekly is in balance and I consider the daily in balance as well.
Image 3. Putting a four day balance in perspective
Price Action Analysis
The action at the lows was a textbook case study of exhaustion. Note on the footprint the seller attempt to initiate below 4972 - a level we had on watch. Notice the blue prints on the bid side of the footprint with “x 0s” (the left side)? That is a sign of no remaining sellers - the zeros indicate a vacuum of offers above.
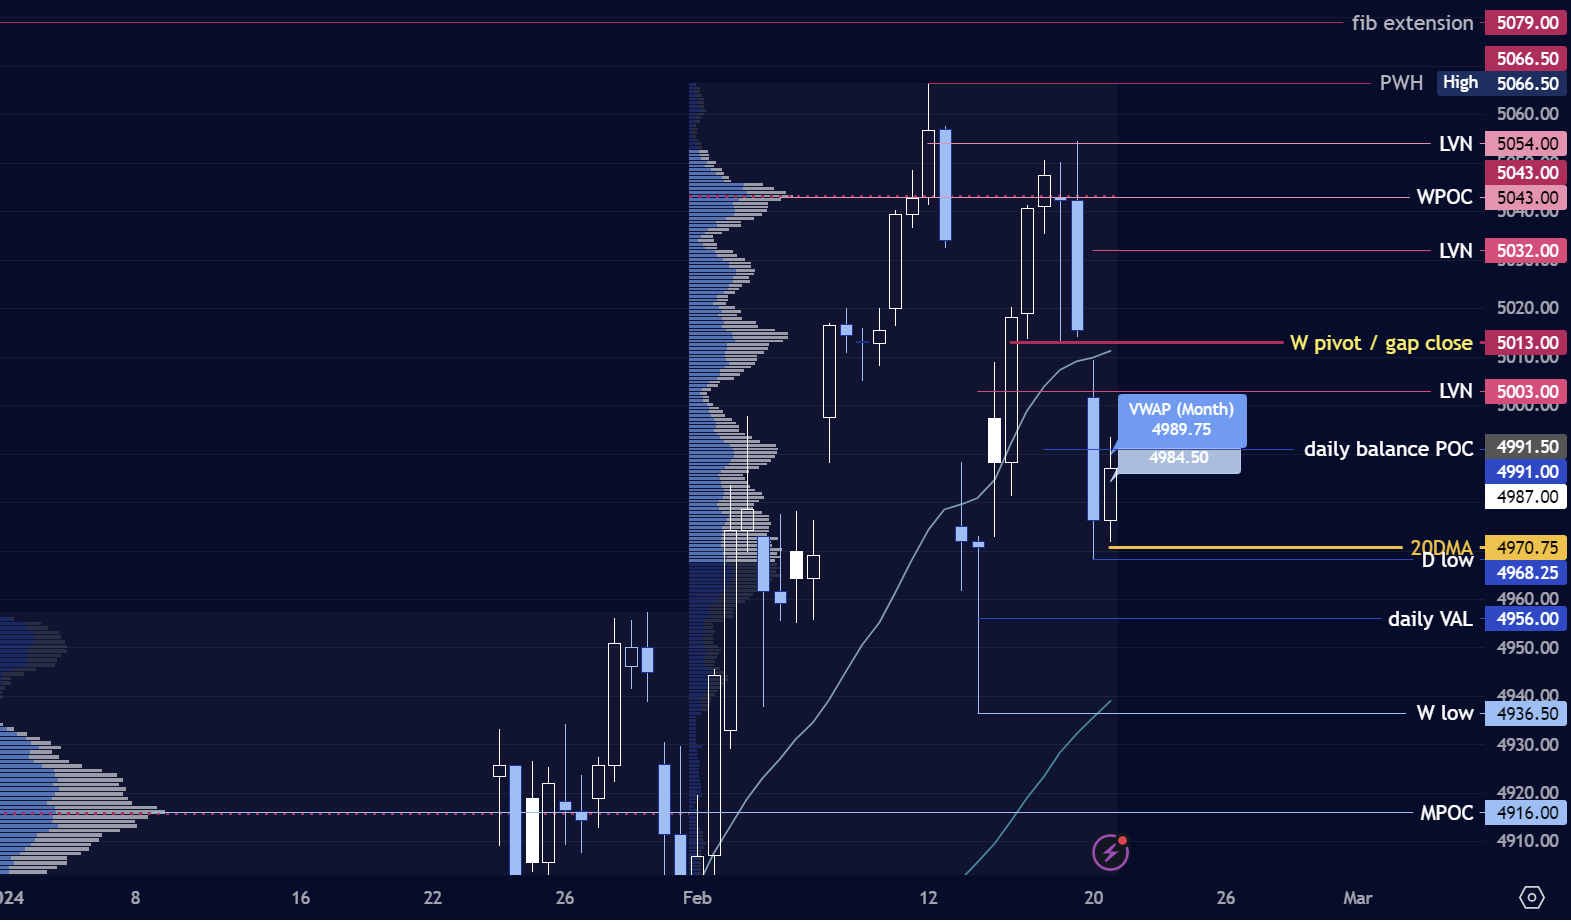
The principles of absorption, exhaustion, and initiation are visible on both footprint and more conventional candle charts. I share both below.
Image 4a. Footprint analysis of Tuesday lows
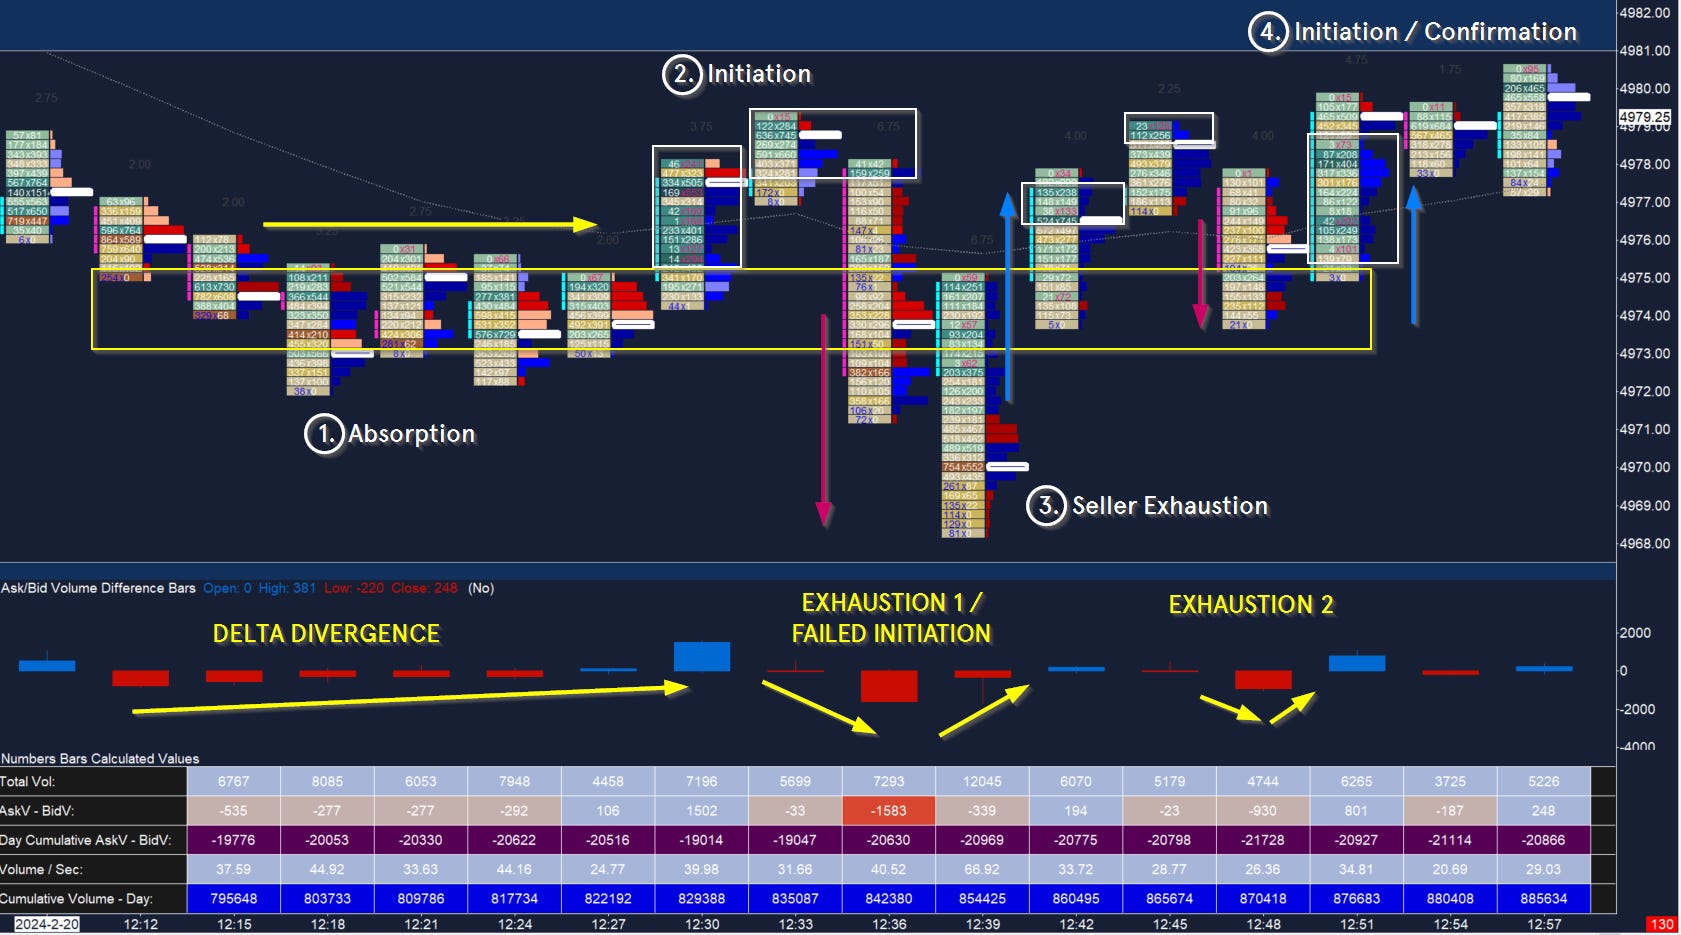
Image 4b. Candle cart analysis of Tuesday lows
Wednesday Plan and Levels
Pivot 4998. This is the D period high and Tuesday IB mid, and more importantly, the selling tail above. Sellers want prices (and time!) below 5000, as well as a defense of Tuesday’s high to engage daily OTFD which can see momentum build in the favor. Especially on the break of the PDL.
Buyers at a limit want to defend 4981 where we saw heavy activity on Tuesday, with an aim to break the PDH targeting a gap fill.
a) Buyers spending time above pivot early on target LVN 5012 (and gap close) into 5027 and 5043. Further above is Friday high 5054.
Buyer LIS 4981.
b) Preferably early defense of the pivot targets a break of 4981 - momentum below can aim for PDL 4968, finally weekly level 4956 which is expected to be defended.
c) VIX over 16.55 can release selling volatility, while breaching 14.70 supports the buyers. TSLA is the weak one out, needing to reclaim 195 for a shot at 200, below 190 can see an attempt at 187.50. can stay bid over 195, although dips are possible. Similarly AAPL needs to show strength over 184 - a key level. Finally I won’t be betting on NVDA afterhours, however 708 is a key level to retake intraday with 719 and 730 above. I believe 682 is the level needed to hold on the downside.
Image 5. 4H TF, Critical ES levels
Tip jar - support my continued work!

Your support is appreciated and helps keep my publication going. I do my best to respond to everyone in a timely way.
Be sure to follow me @rareverend on X (Twitter) for the latest updates!
Don’t maintain bias in the face of contradicting information! Capital preservation is key.
This is CERTAINLY not investment advice and I am not a qualified licensed investment advisor nor a minister of the church. All information found here, including any opinions, commentaries, jokes, outright mistakes, and suggestions - expressed or implied herein - are for informational, entertainment or educational purposes only and should not be construed as personal investment advice. While the information provided is believed to be as accurate a picture of trade as I see it, it is after all how I see it and errors or inaccuracies are practically expected. I will not and cannot be held liable for any actions you take as a result of anything you read here. As always, conduct your own due diligence, or consult a licensed financial advisor or broker before making any and all investment decisions. Any investments, trades, speculations, or decisions made on the basis of any information found on this site, expressed or implied herein, are committed at your own risk, financial or otherwise.
Is that $TICK right below the candle chart analysis? And if so it’s not the NYSE by chance correct?