
Feb 1, ES Plan and Missal: Calling Tops
Short timeframe traders killed the market.
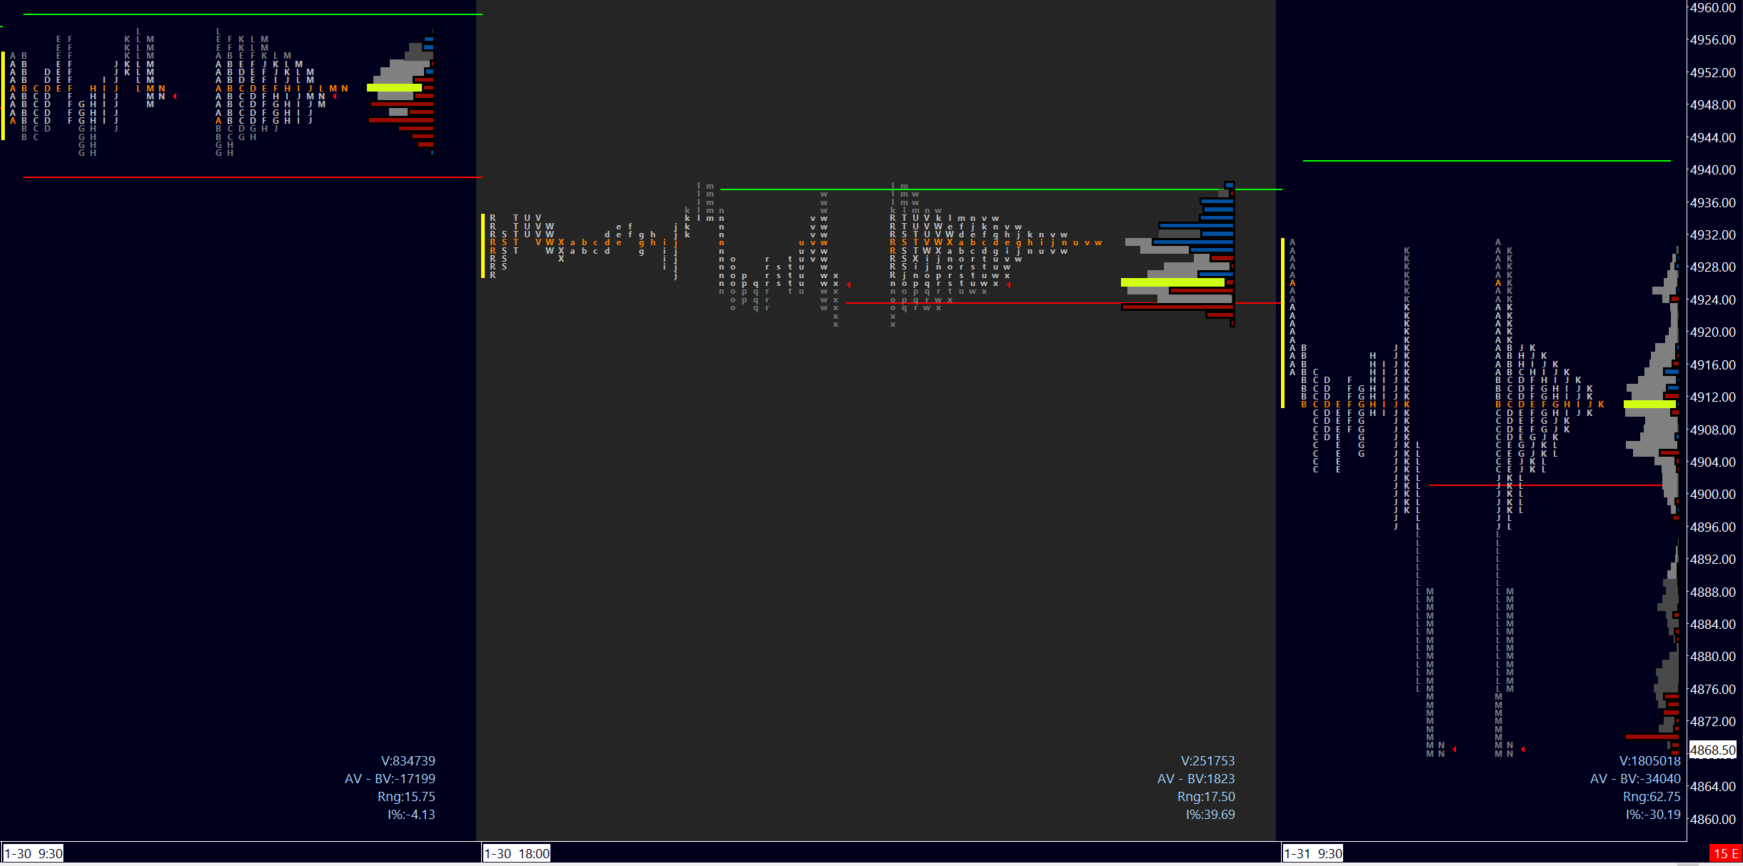
Image 1. Light scaffolding that was 4900. Fan Ho.

Yesterday’s Missal had a tongue in cheek reference to the buyers Yesterday’s Missal had a tongue in cheek reference to the buyers above 4900, in the form of a flying penguin. Sure it may fly if it flaps hard enough, but buyers were in a somewhat similar position, flying high with the short covering on Monday but with little momentum, what turned out to be a trap on Tuesday.
There has been very little volume on the tape all year, and large players have been noticeably absent. I think this all changed with the presence of a large seller I identified last week, at the 4930 level. It was no coincidence that this level was tested twice today, although this market has been dominated by short-term traders. Note the exacting support at 4900 until it gave way. I’ll be zooming in below this latter area for tomorrow’s session.
Read on.
Minister’s Missal
To sum up, Wednesday was a liquidation of very short term traders. Will big money step back in to ‘save the day’ or will sellers finally take initiative? The ball is in their court and tomorrow’s RTH action will provide strong clues.
After an uneventful Tuesday, the real intrigue (and selling) happened immediately on the close. Indeed the settle price (16h15EST) was just at the LOD. Globex open was already at the level of the selling level of interest (4930) and despite churn in ETH we opened on a true gap down on net short inventory. I keep repeating - a net short or long overnight inventory has a 70% chance of correction (or counter-auction) at the open, and a failure to do so can see continuation in the original direction of the move.
In fact we barely tested the 4930 level before heavy buyer absorption was clear and sellers initiated back through the open. The 4913 level was our first target below 4920 and this was achieved in IB. Now below our pivot and the buyer LIS - with VIX steadily climbing - the odds were against the longs. Ideally with this combination the astute trader would wait for a short re-entry.
Better yet to wait until after FOMC.
And thus the FOMC statement saw us drop almost exactly to our last seller target 4985 before the Powell presser at 14h30EST took us back into the highs - and nearly to the tick at 4930! Once again a strong sell off of this levels saw us break support, with L period in full price discovery mode into some of our weekly targets. With sellers managing to break the PWL 4873, we are now back in balance on the weekly.
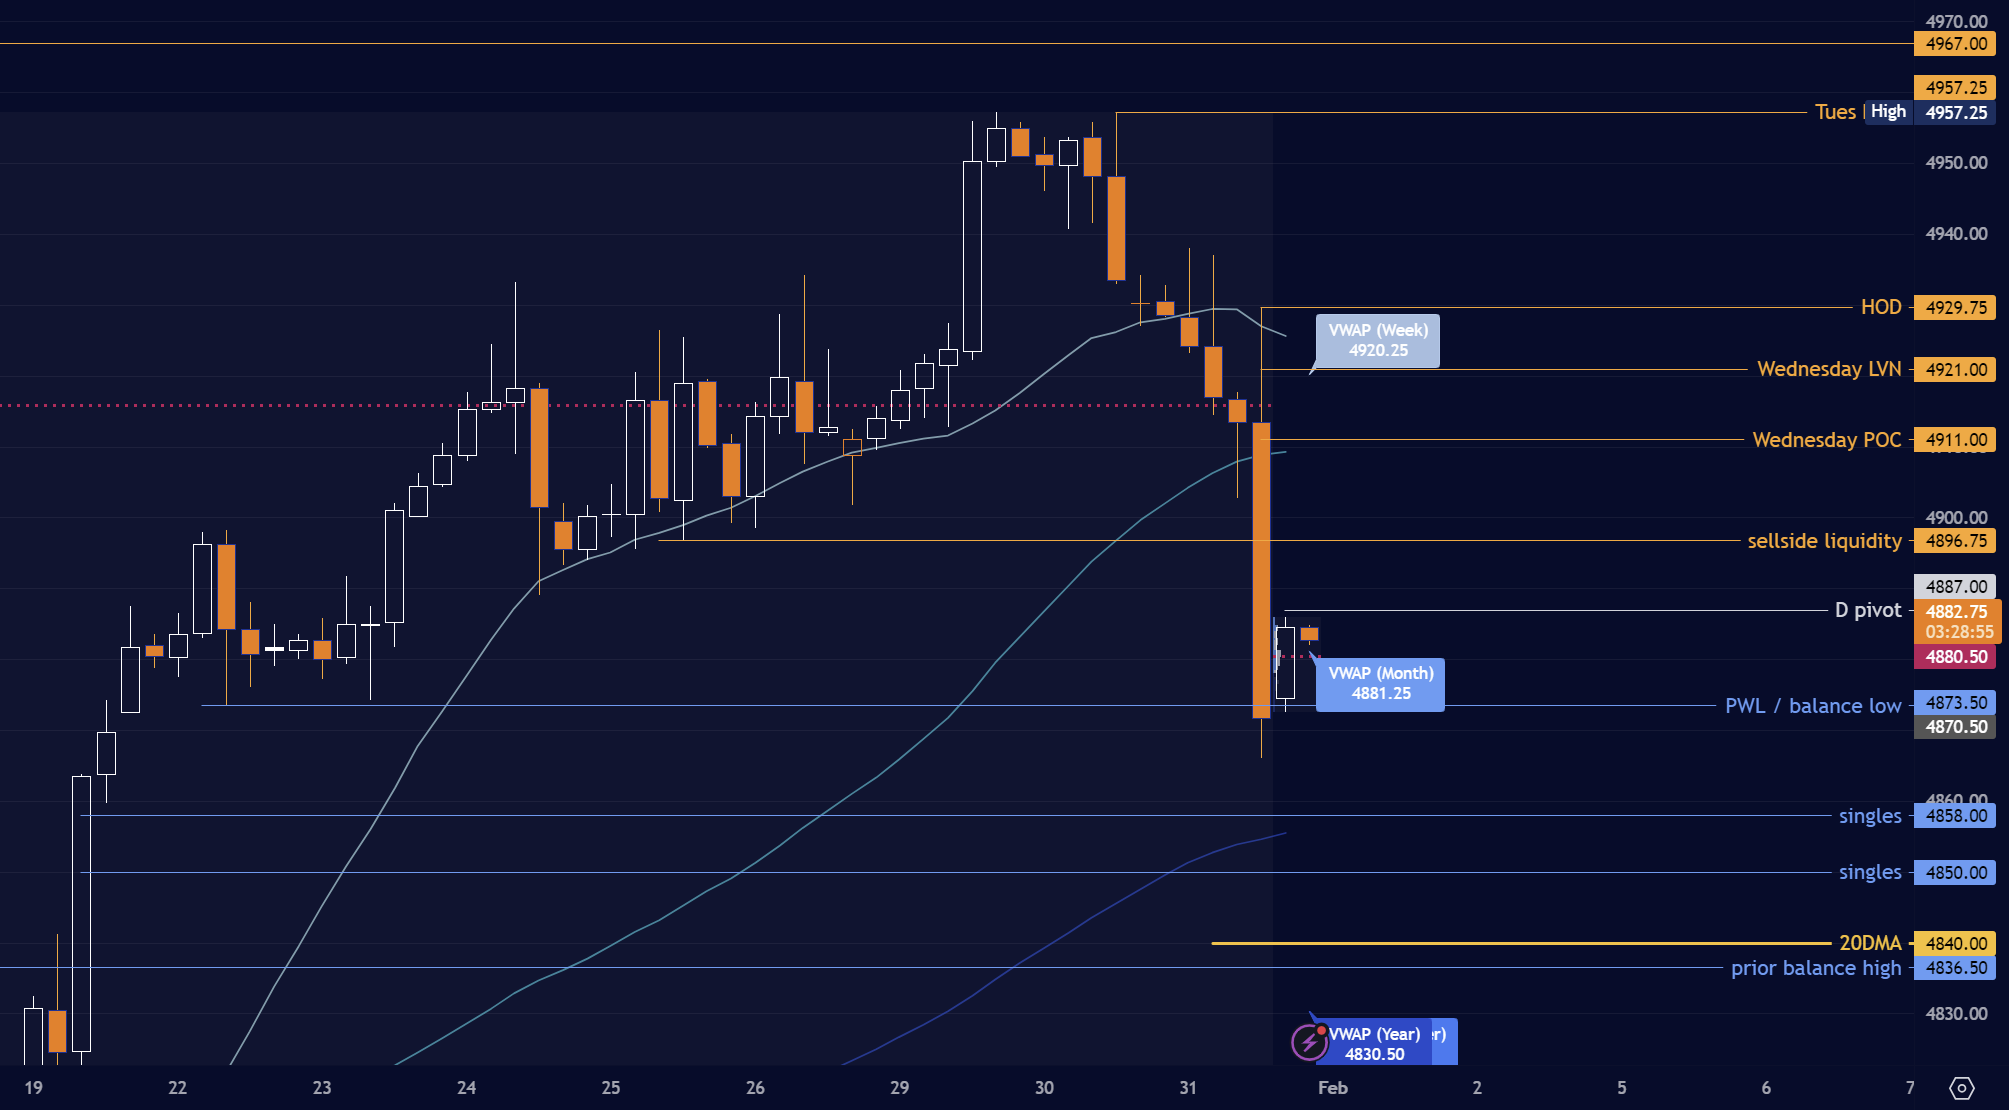
The day formed a triple volume distribution with nodes at 4896 and 4881, although the TPO chart is a ‘p’ shape indicative of long liquidation, with poor structure below 4896. Note the day low at 4868.25. Recall the levels from my weekly note:
4895 buying tail
4873 PWL
4837 prior balance high
4813 prior balance POC
Image 2. Tuesday RTH, Wednesday ETH and RTH sessions
Thursday Plan and Levels
Buyers must now attempt to pick up the pieces of this sell. Can they accomplish similar results dip buying selloffs as in the last few months? Specifically I will be looking at the area of L period singles from Wednesday at 4887 as Thursday’s pivot.
a) Buyers spending time above pivot target an hourly close above 4907, Wednesday's initial level of support - sellers may defend 4895 along the way. Further above note Wednesday ETH ONL 4921, as well as the critical 4930-4934 (breakout) area which would be a full rout of the sellers. Closing above this could very well target a gap close - although that’s an ambitious target for the day after FOMC..
The 4850 level can act as a LIS.
b) Pressure under 4867 or an hourly close below the ONL targets a repair of singles to 4850, where patient buyers may find a bid. The next area of poor structure is 4842, with the prior 4837 level of breakout immediately below. This also coincides with the 20DMA around 4840 - an area which will likely see buying if 4850 were to fail.As a reminder NPOC 4830 is worth marking down on your charts.
The 4907 level can act as a seller LIS.
c) The VIX below 13.82 can see some support for buyers, conversely above 14.90 can mean further selling. Look for AAPL to catch a potential bid at 184 which may relieve some selling pressure in the indices, similarly TSLA could see a test of 185 which will need support to prevent a deeper sell.
Image 3. 4H TF, Critical ES levels
Tip jar - support my continued work!

Your support and comments are appreciated. I do my best to respond to everyone in a timely way. Be sure to follow me @rareverend on X (Twitter) for the latest updates!
Don’t maintain bias in the face of contradicting information! Capital preservation is key.
This is CERTAINLY not investment advice and I am not a qualified licensed investment advisor nor a minister of the church. All information found here, including any opinions, commentaries, jokes, outright mistakes, and suggestions - expressed or implied herein - are for informational, entertainment or educational purposes only and should not be construed as personal investment advice. While the information provided is believed to be as accurate a picture of trade as I see it, it is after all how I see it and errors or inaccuracies are practically expected. I will not and cannot be held liable for any actions you take as a result of anything you read here. As always, conduct your own due diligence, or consult a licensed financial advisor or broker before making any and all investment decisions. Any investments, trades, speculations, or decisions made on the basis of any information found on this site, expressed or implied herein, are committed at your own risk, financial or otherwise.