
Failed Breakout Setup Example
ES: Wednesday, August 16, 2023 11h03EST

As a part of the trading educational library, I will be posting a setup reference manual of key core setups I use to trade every product (options, futures, stocks). There are four key setups, with variations on each. For example the ‘failed breakout’ pictured below and its corollary, you guess it…the ‘failed breakdown’. Today’s material is an example of the FBO; the manual will be shared in the coming weeks for free and a detailed course on each setup may be published at a later date.
Maintaining core setups is key to a) recognize patterns; b) define risk and targets; c) gain consistency; d) exercise discipline. It cannot bear enough repeating: consistency is key to success. In any endeavor. Waiting for and deploying setups requires discipline and practice. And what works for one trader may not work for all.
Regardless these are not entirely original setups as we are not reinventing the market here. With some modifications they suit my style and timeframe - I expect you will do the same.
For more setup examples and content, take a jump to my twitter at @rareverend .
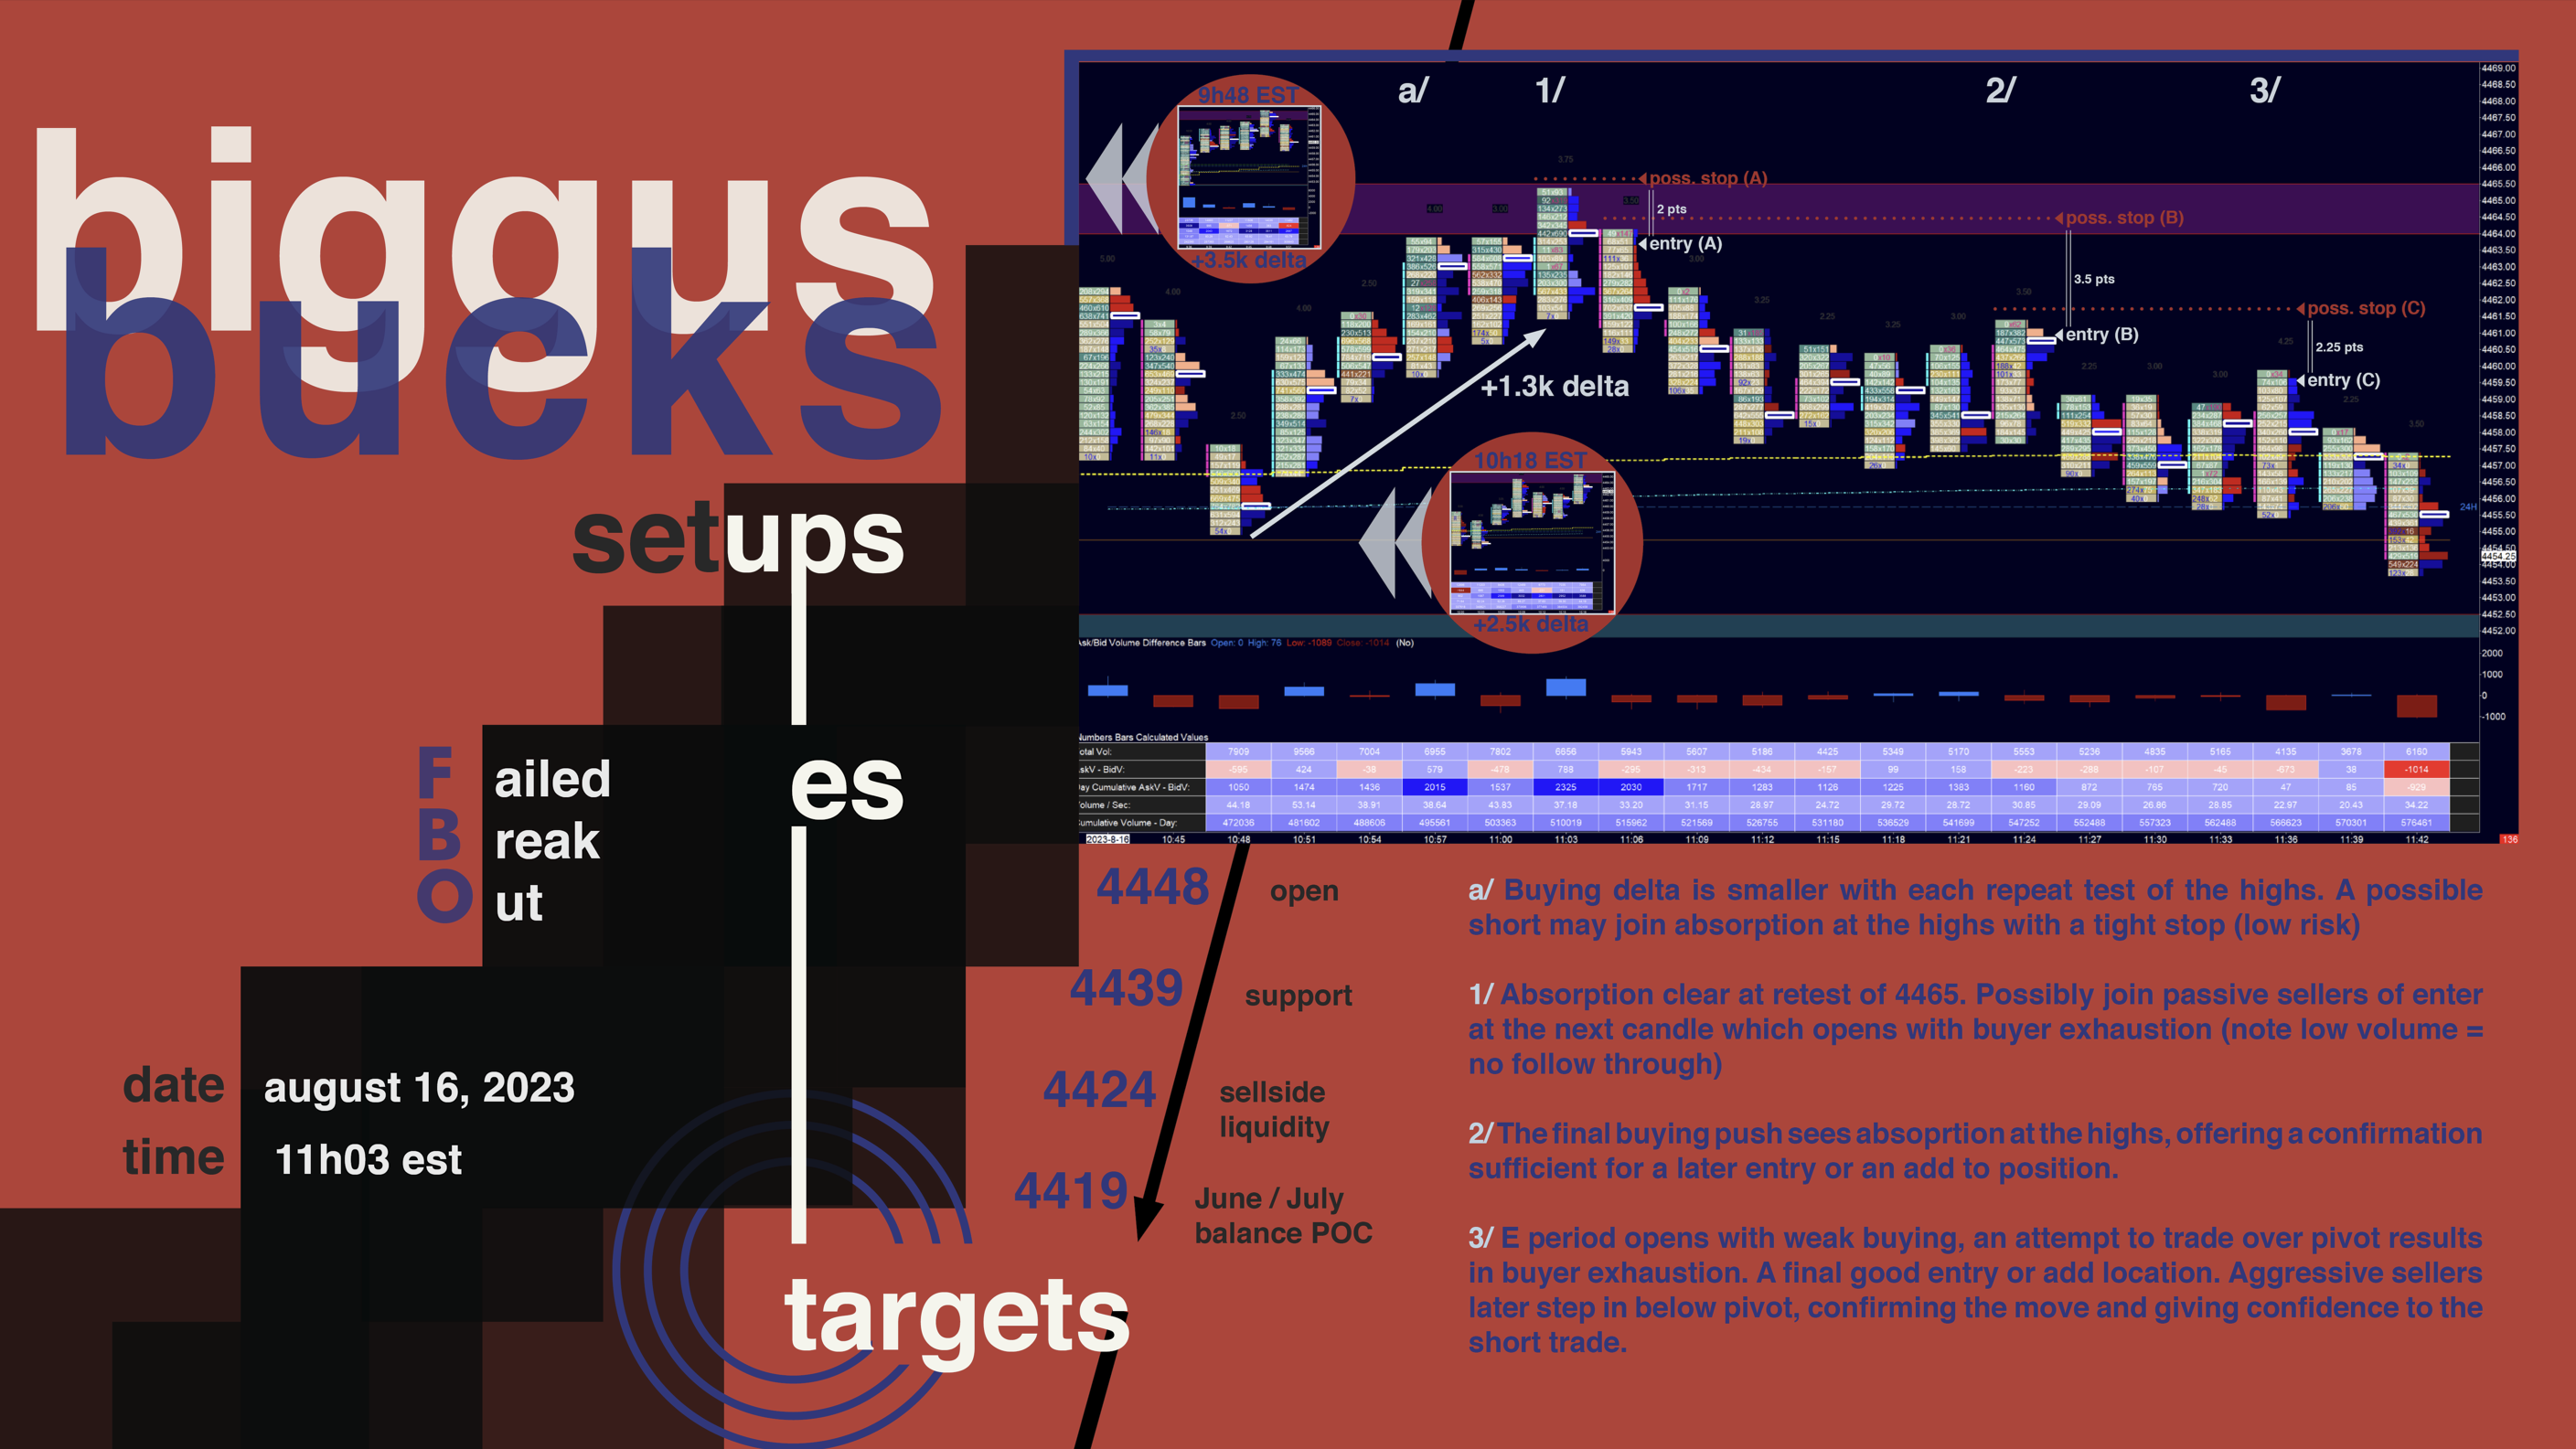
Image 1. Failed Breakout
FAQs
To answer some anticipated questions, these charts are based on a 3 minute footprint of prices in ES, using the SierraCharts platform. This is simply the timeframe that works best for my style. Others may choose to use a 30s, 1m, 5m, or even 30m. For more traditional candlestick chart-based traders, these setups also work; the patterns expressed are complimentary and the speed and manner of candle formation can be interpreted to gain an edge. The footprint however gives you an ‘x-ray’ into each candle body by examining order flow (bids and offers, as well as delta - the difference between the two). Ultimately there is no one way to do things, or for that matter a panacea.
This will be clearly explained in course material later, so don’t despair. The upcoming manual will also provide a quick overview to help you get started.