
ES Weekly Review and Outlook: Mar 4 - 8
The Powell Pause.
Image 1. Another decadent screenplay. Scorsese, Taxi Driver (1976)

Welcome to all my new followers, I am glad you have joined the congregation. Each weekend I provide a ‘sketch’ or Outlook of main levels and primary drivers of the price action ahead. I do not regularly make ‘predictions’ as I am a discretionary trader, although I have a sense of how the action may play out based on the most current information.
Information changes all the time. Just like the weather report (through probabilities, the essence of trading) gives you an idea whether you’ll need to dust off the rain jacket, it can’t tell you with certainty if - let alone where - lightning may strike. When was the last time you picked your Thursday outfit on Sunday based on the weekend weather forecast?
Furthermore I share regular educational content on macro topics, price action, market structure, and trader psychology. I also provide frequent analysis on intraday order flow, with primers on interpreting market generated information (MGI) in profile, footprint, and traditional candle charts.
This week’s Outlook features a well-known classic film, Taxi Driver. An unstable veteran scarred by war drives a taxi during the late hours of a Sodom and Gomorrah New York City. This only fuels his instability, driving him to seek recourse in violence. After 16 of 18 green weeks, are scarred sellers near the point of violence in the face of a decadent market?
To do so they must first swiftly reject the latest breakout. While I don’t speculate based on option flows, the recent heavy put side could be anything from hedging against 5200, to something with the look of a correction. Regardless there is a key level to watch early this week.
Minister’s Missal
Last week’s Outlook was subtitled Showdown, as I expected the establishing auction following the last price imbalance to come to a conclusion before the end of the week. I also assumed that sellers had the initial edge, which was the right direction until support was found exactly at the 5067 buying tail level.
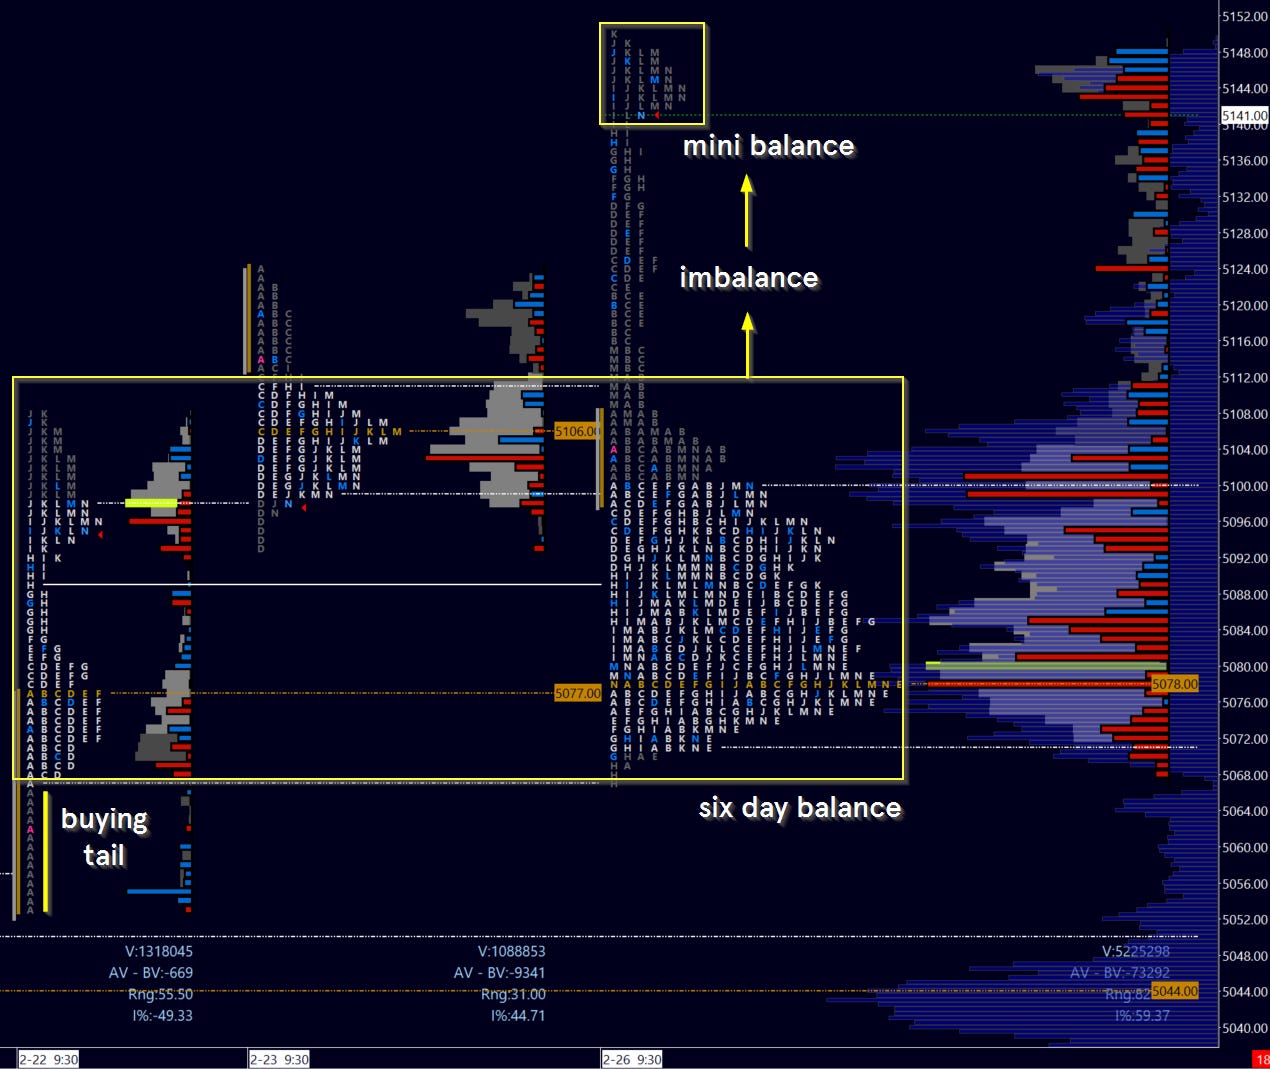
This was no surprise; this was the level sellers needed to push through to the gap below. Why is that? - buying tails (Image 3) are zones of strong buyer intent. If these committed buyers were to be knocked out, this shows a lack of interest in going higher and potentially introduces prices into a vacuum of demand below.
First let’s take a look to the Outlook scenarios and break them down in terms of the action that transpired.
Image 2. February 25 Weekly Outlook scenarios
First, the sellers were able to defend the 5112 ‘gate’ on Monday, marking 5108 as the high before a close at the day’s lows. By Tuesday sellers were on the offense with daily OTFD that held into Wednesday.
However, buyers successfully defended the 5067 level, putting in a higher low Wednesday. Thursday broke the short-lived daily OTFD, taking control away from sellers. Not only this but the 5112 gate (which was broken and rejected on February 23, Image 3) was again tested on Thursday, with high volume market on close (MOC), indicating participants were fine with paying the closing price. A strong conviction if you ask me.
Breakout came Friday. A painful day for many fellow traders attempting short. Remember the rule: go with the break of balance unless rejected (by other traders, don’t be a hero!). In which case an equal and opposite reaction can take place, often in the form of a traverse of the value area. We then arrived at the 5146 level indicated as the plan, and just three ticks shy of the 5150 psych level.
How cool is that.
Image 3. Prior week profile and area of balance to imbalance
So did we ‘predict’ the location of lightning strikes? Certainly not! But through years of watching screens we get a good sense of what prices attract business and the conditions, or the path required, to get there.
Additionally I cautioned in the last Outlook that “participants are groping for the climax…at the expense of bank accounts…” Again, let others find the top for you. And if you must short a breakout, be sure to keep your targets tight and your stops even tighter. The first rule of the game is to stay in the game: to protect your capital.
Finally I got the range wrong - at just over 80 points rather than my expected 110. Compression was tight and the breakout only took place on the final day of the week.
Weekly Context
The weekly is a very strong OTFU, one I have not seen in my years of trading. This is NOT a bear market rally; I gave up that possibility way back in November and wrote about it. Check out the weekly candles below.
Image 4. Road to (anti-?)Nirvana. ES weekly candles
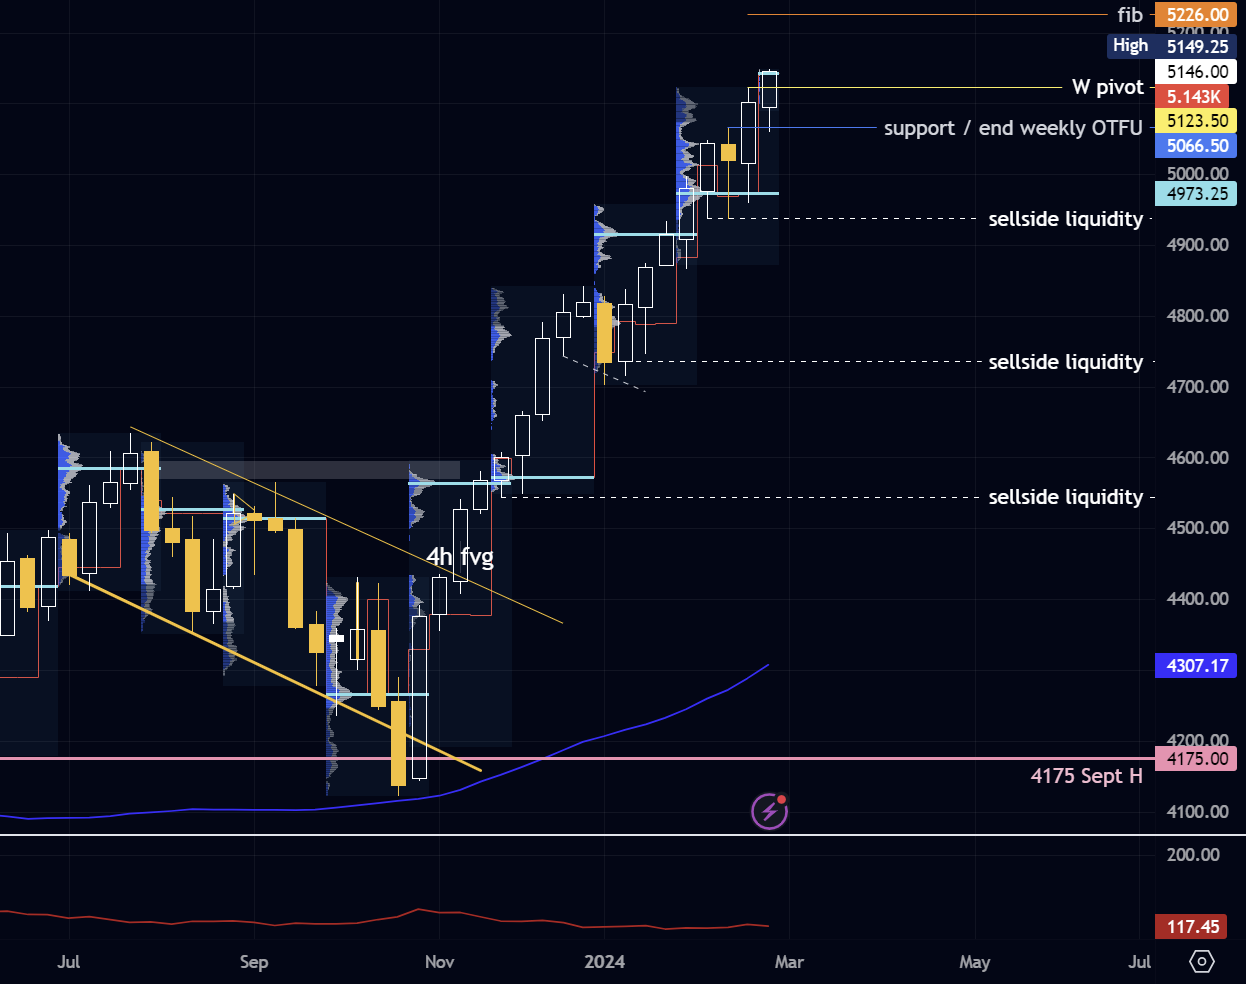
Sixteen of eighteen weeks are green, with the most significant drop during the expected new year tax harvesting season. In other words sellers standing aside.
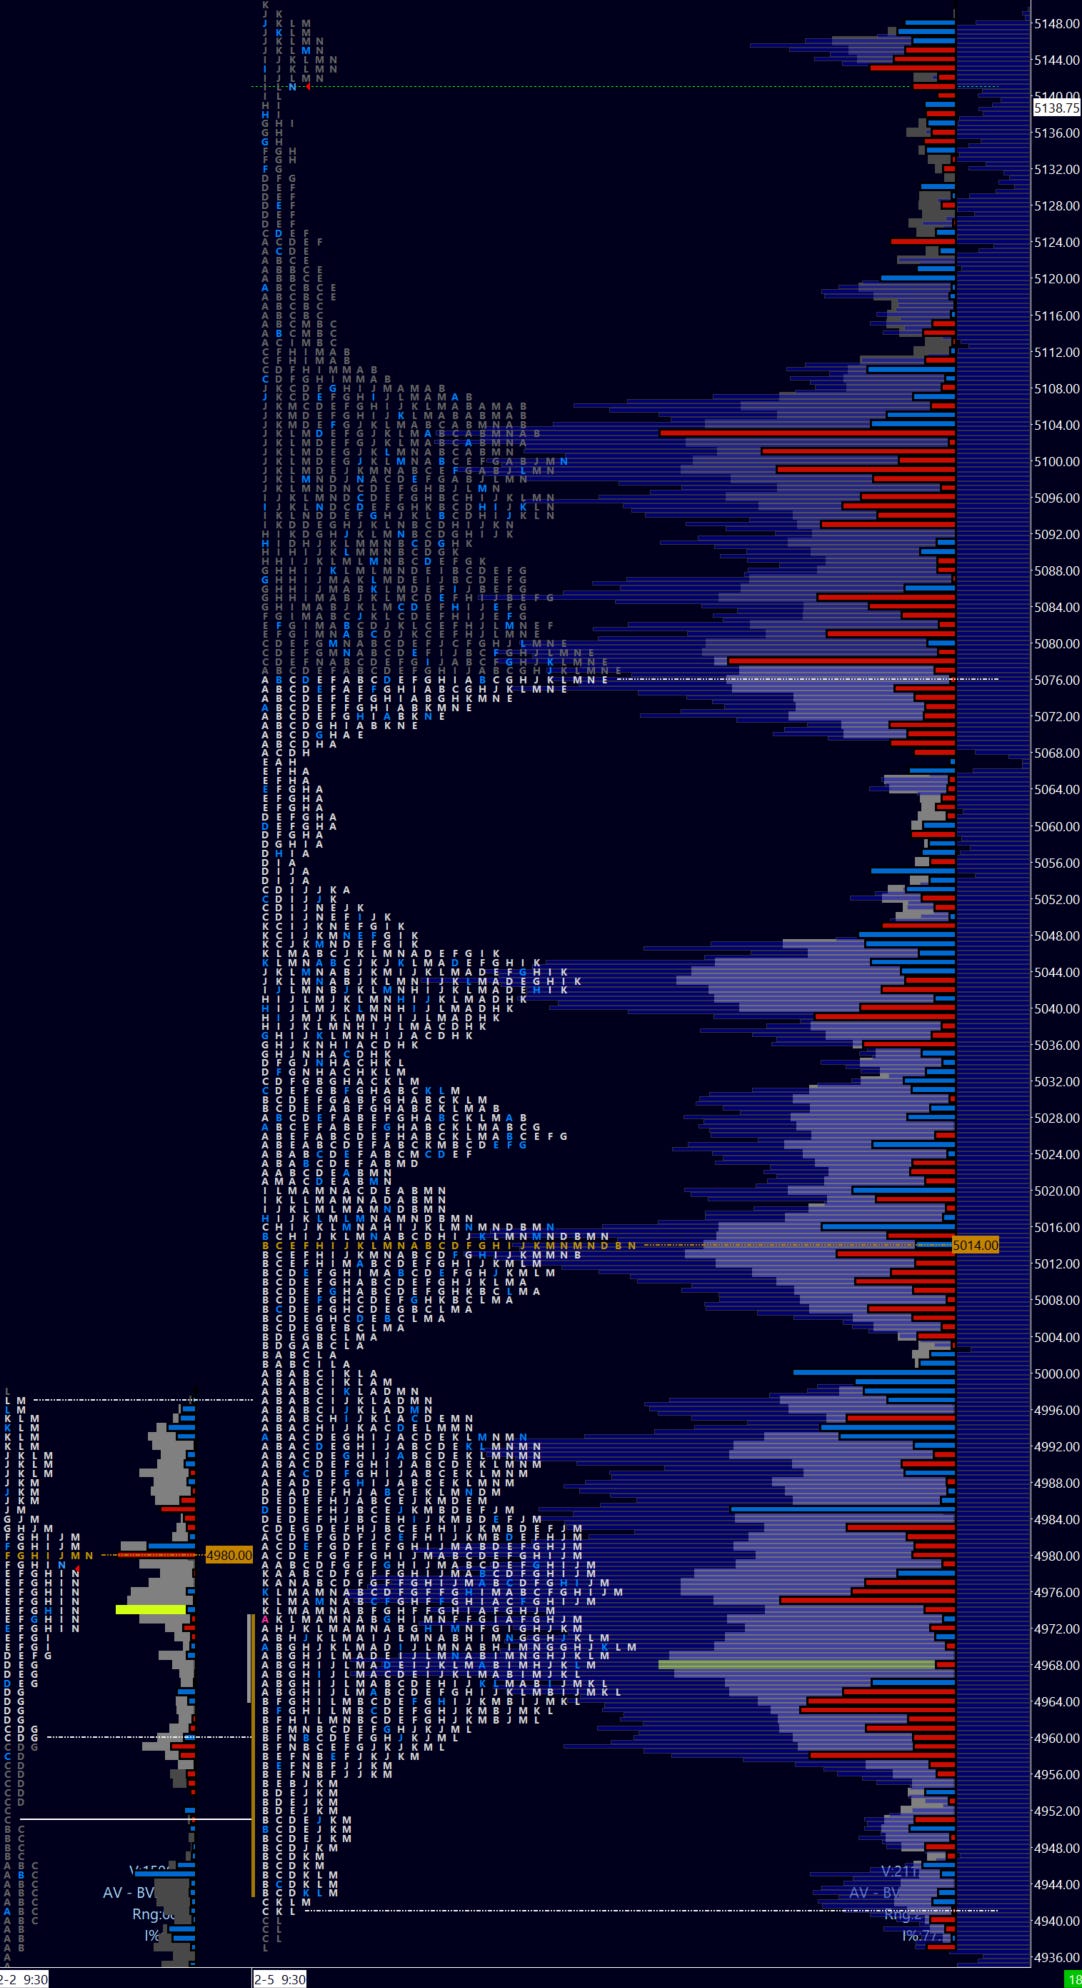
Image 5. Medium-term profile, ES
There is little indication that the Fed is looking to cut rates any time soon. As I have been saying for months now, I think Q3 is the earliest that we can see rate cuts. I no longer think the narrative of rate cuts are driving equity prices higher. In fact rate cuts likely mark a peak but that is a topic for a longer macro note. What is the main risk to the economy in my view? Most likely a credit event (definitely not AI stocks or BTC, brothers and sisters).
Speaking of the Fed, we have many Fed presidents making remarks this week, with big item Powell’s testimony Wednesday and Thursday. The week can be potentially volatile given this and the wall of data into Friday.
Last week’s profile is a ‘b’ shape, or seller absorption leading to price discovery (imbalance) to the upside. The end of Friday created an area of mini-balance which may provide clues on direction early this week. Buyers look for continuation with a break of the PWH on the road to 5200.
Sellers look for a rejection of the breakout with a daily close below the 5123.50 breakout and ideally a traverse of last week’s value area to 5071, with a break of weekly OTU just below at 5066. Short-term (5 day) value is at 5078 while medium-term (20 day) further below at 5014. Note the volume shelf at 5046. This is a clear area for longer-term buyer support (if we get there).
I will interpret the level of breakout 5123.50 as the pivot for the week ahead.
Data Watch
Fed talk to bring volatility this week. I expect a possibility of a 100 point range ahead, with possible 15 point overshoot.
Data of note:
Tues, Mar 5: Eurozone inflation premarket; services PMI 10h00EST
Weds, Mar 6: Powell testimony, JOLTS 10h00EST; Beige Book 14h00EST
Thurs Mar 7: Eurozone rates 8h15EST; unemployment 8h30EST; Powell testimony 10h00EST
Fri, Mar 8: hourly earnings, non-farm employment 8h30EST
This Week’s Levels and Plan
Pivot 5123.
Levels to mark:
5226 fib extension
5206
5185-91 zone
5149 PWH
5123 weekly pivot
5087 support
5071 PWVAL - 5066 break weekly OTFU
5046 volume shelf
5014 medium-term value
Image 6. All current ES levels, 4H chart
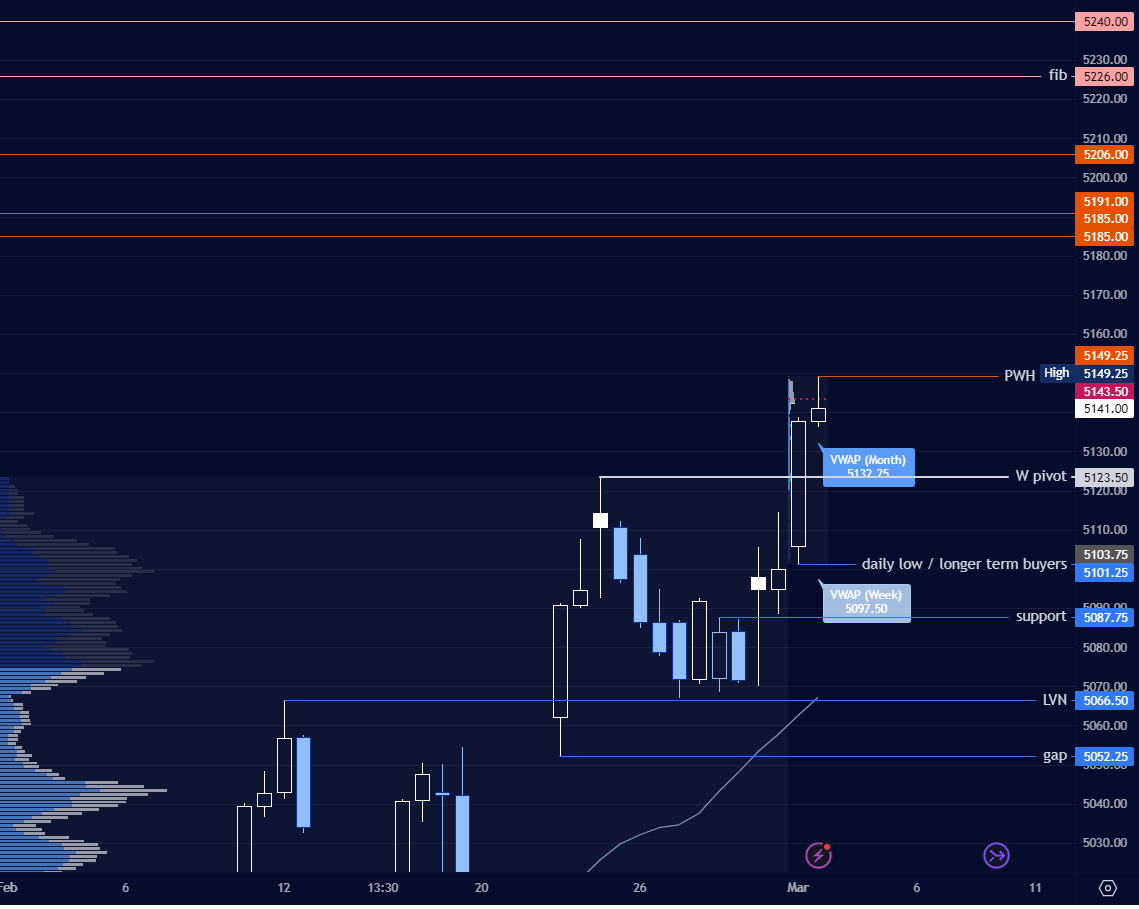
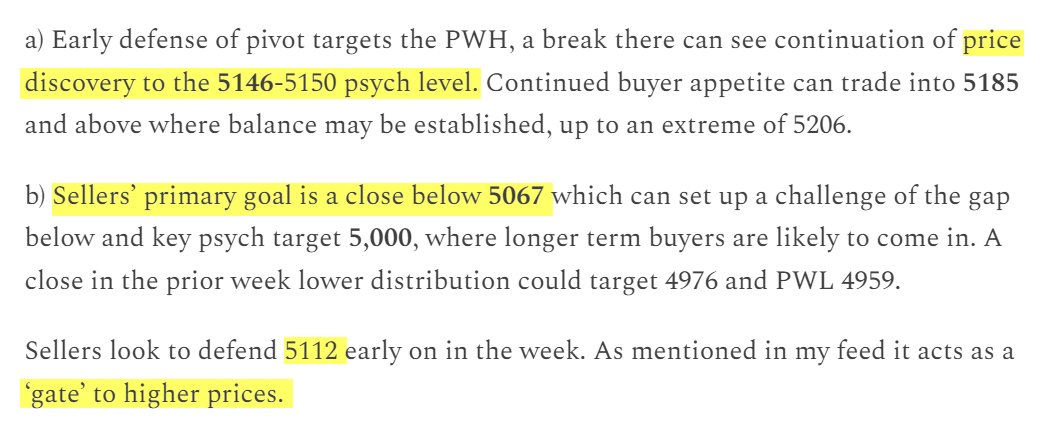
a) Defense of 5123 and a break of PWH 5149 targets 5185-91 where sellers may step in. A close above 5206 may target 5226 with an overshoot into 5240 as a lesser possibility.
b) Sellers closing below pivot look to traverse prior week value area to 5071, with 5101 and 5087 potentially offering a responsive bid along the way. Further below is 5046 for a longer-term support.
c) I did not receive requests for tickers to review this week, feel free to drop some in the comments below or on my X (Twitter) feed.
TSLA is in a tight range which promises range expansion on a break, perhaps 16 points or more. Buyers target a close above 205.60, targeting HVN 2010 and 215. Sellers backing down could see as high as the 221.50-223 zone targeted. A breakdown may be less likely given market strength, however a close below 198.50 could attempt sellside liquidity at 190 challenged, a break of which targets 184.60. Look for 201.80 to be support early on for upside.
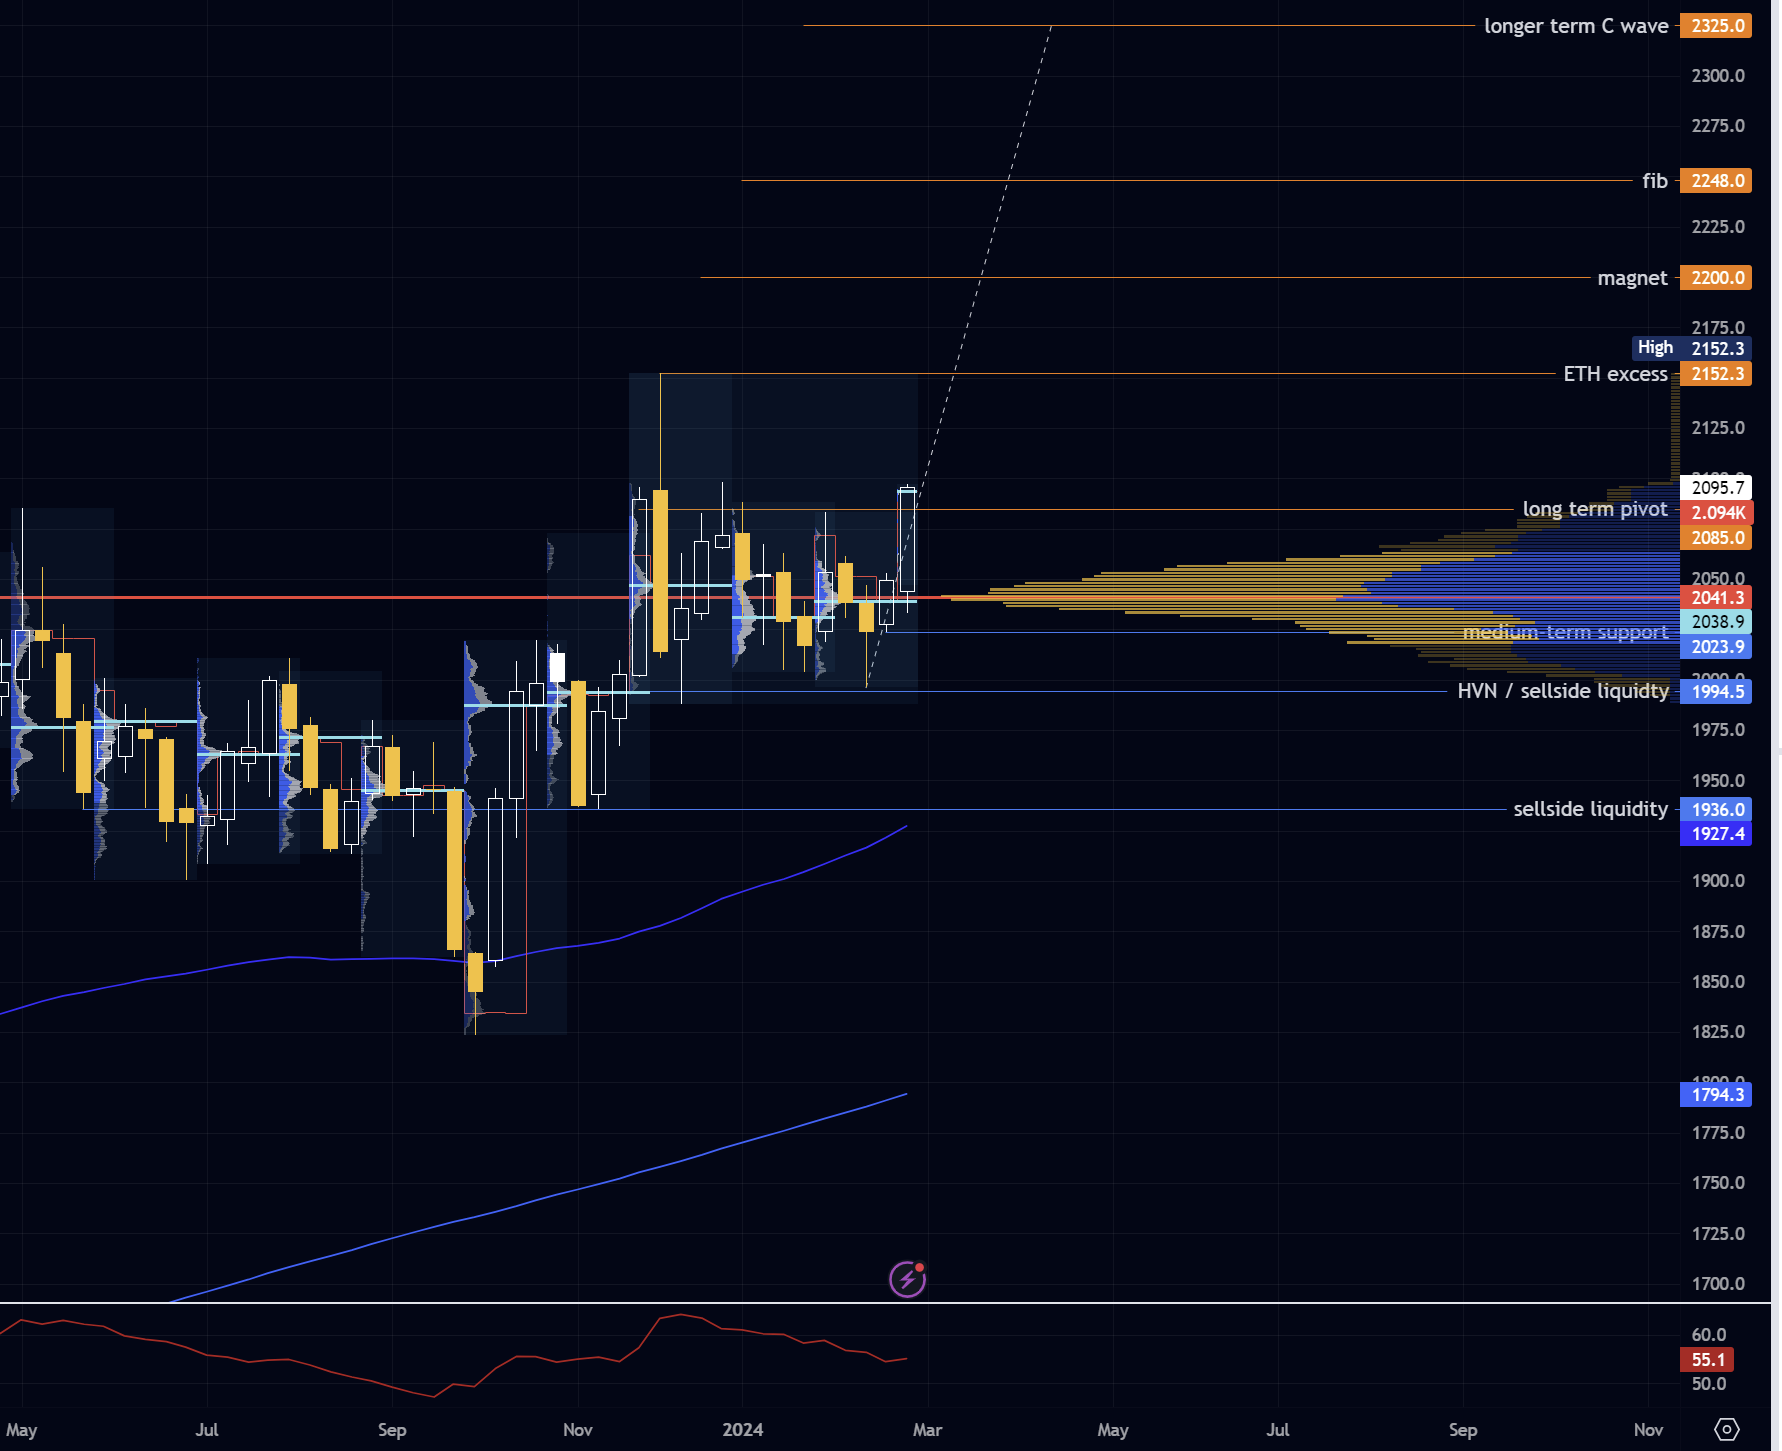
The breakout in gold (GC) this week did not go unnoticed. I have been mentioning the significance of the 2085 level since the middle of last year. This can act as a medium-term pivot; support here and follow through targets a close above 2152. Further momentum could magnet to 2200 and 2247.50 this month. On the other hand a rejection with a close below 2050 could frustrate the gold bugs (why not bulls? I find this derogatory!) with more drawn out range. Watch 2068 for early support this week.
Image 7. Dreams of gold; longer-term levels and balance profile
Tip jar - content is free, I appreciate your continued support!

This journal remains free, but you can support my work by liking and commenting, and most of all by sharing my work with folks you know or on Twitter. Your support is hugely appreciated and helps keep my publication ongoing and timely! Be sure to follow me @rareverend on X (Twitter) for the latest updates.
Don’t maintain bias in the face of contradicting information! Capital preservation is key.
This is not investment advice as I am not a qualified licensed investment advisor. All information, opinions, commentaries, and suggestions, expressed or implied herein, are for entertainment or educational purposes only and should not be construed as personal investment advice. While the information provided is believed to be accurate, it may include errors or inaccuracies. I will not and cannot be held liable for actions you take as a result of anything you read here. As always, conduct your own due diligence, or consult a licensed financial advisor or broker before making investment decisions. Any investments, trades, speculations, or decisions made on the basis of any information found on this site, expressed or implied herein, are committed at your own risk, financial or otherwise.
PYPL, SNOW., PANW