
ES Weekly Review and Outlook: Jan 22 - Jan 26
Murky miracles
Image 1. Moses squeezing water from rocks. F. Bassano, 17c.

New ATHs in all indices with the S&P joining the trio. On the other hand Russell is still 20% off its peak, arguably bear territory.
This has been on the back of an incredible run from the lows, one I keep repeating has taken place on remarkably low volume. Buyers have finally managed to make excess above a prior ETH high with a massive push into OPEX close - which we were anticipating to a large extent (and even suggested in last weekend’s note). Especially after the lack of downside initiative twice so far this year.
So where are the sellers?
Maybe holding out for PCE or FOMC, but speculation aside I have some key levels below. Read on.
Bonus Friday Trade Review
I’ll begin with a review of Friday’s action and the fantastic trade opportunities it presented, given this was a historic day (for SPX, ES had already made new highs on breaking 4808).
The action was pretty straightforward - a look below and fail into the ON POC and volume shelf. On the failure of sellers to initiate on two occasions, buyers stepped into the vacuum to push through the IB high. A failed retest of IB mid in D period revealed more seller weakness: it was prudent to focus on the long trade by this point.
Finally G period made a\the decisive break. The buy stops fueled an aggresive pop higher and further breakout traders pushed into levels above, surpassing my final target of the day 4870 by a few points. The session closed at approximately this level.
Image 2. Friday ETH and RTH
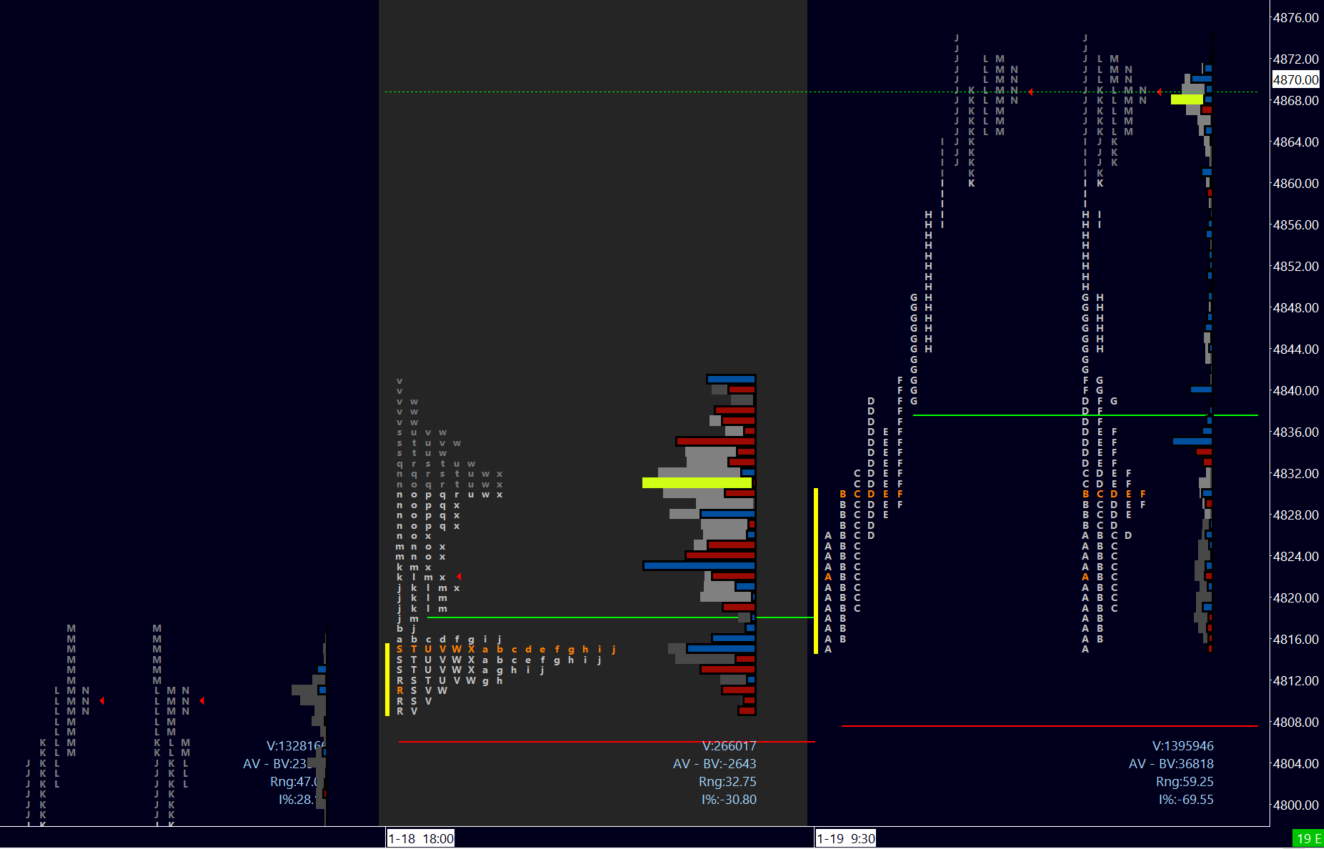
Zooming in on the long opportunities provides excellent examples of low risk trades, leaning against a previously defined liquidity zone or on later weak retests/higher lows. The more conservative later entry was a ‘load the boat’ scenario for the astute trader. A tight stop below the prior lows and very weak seller activity were compelling reasons for a high confidence, low risk long.
Image 3 Friday IB low, some trees bloom twice a season
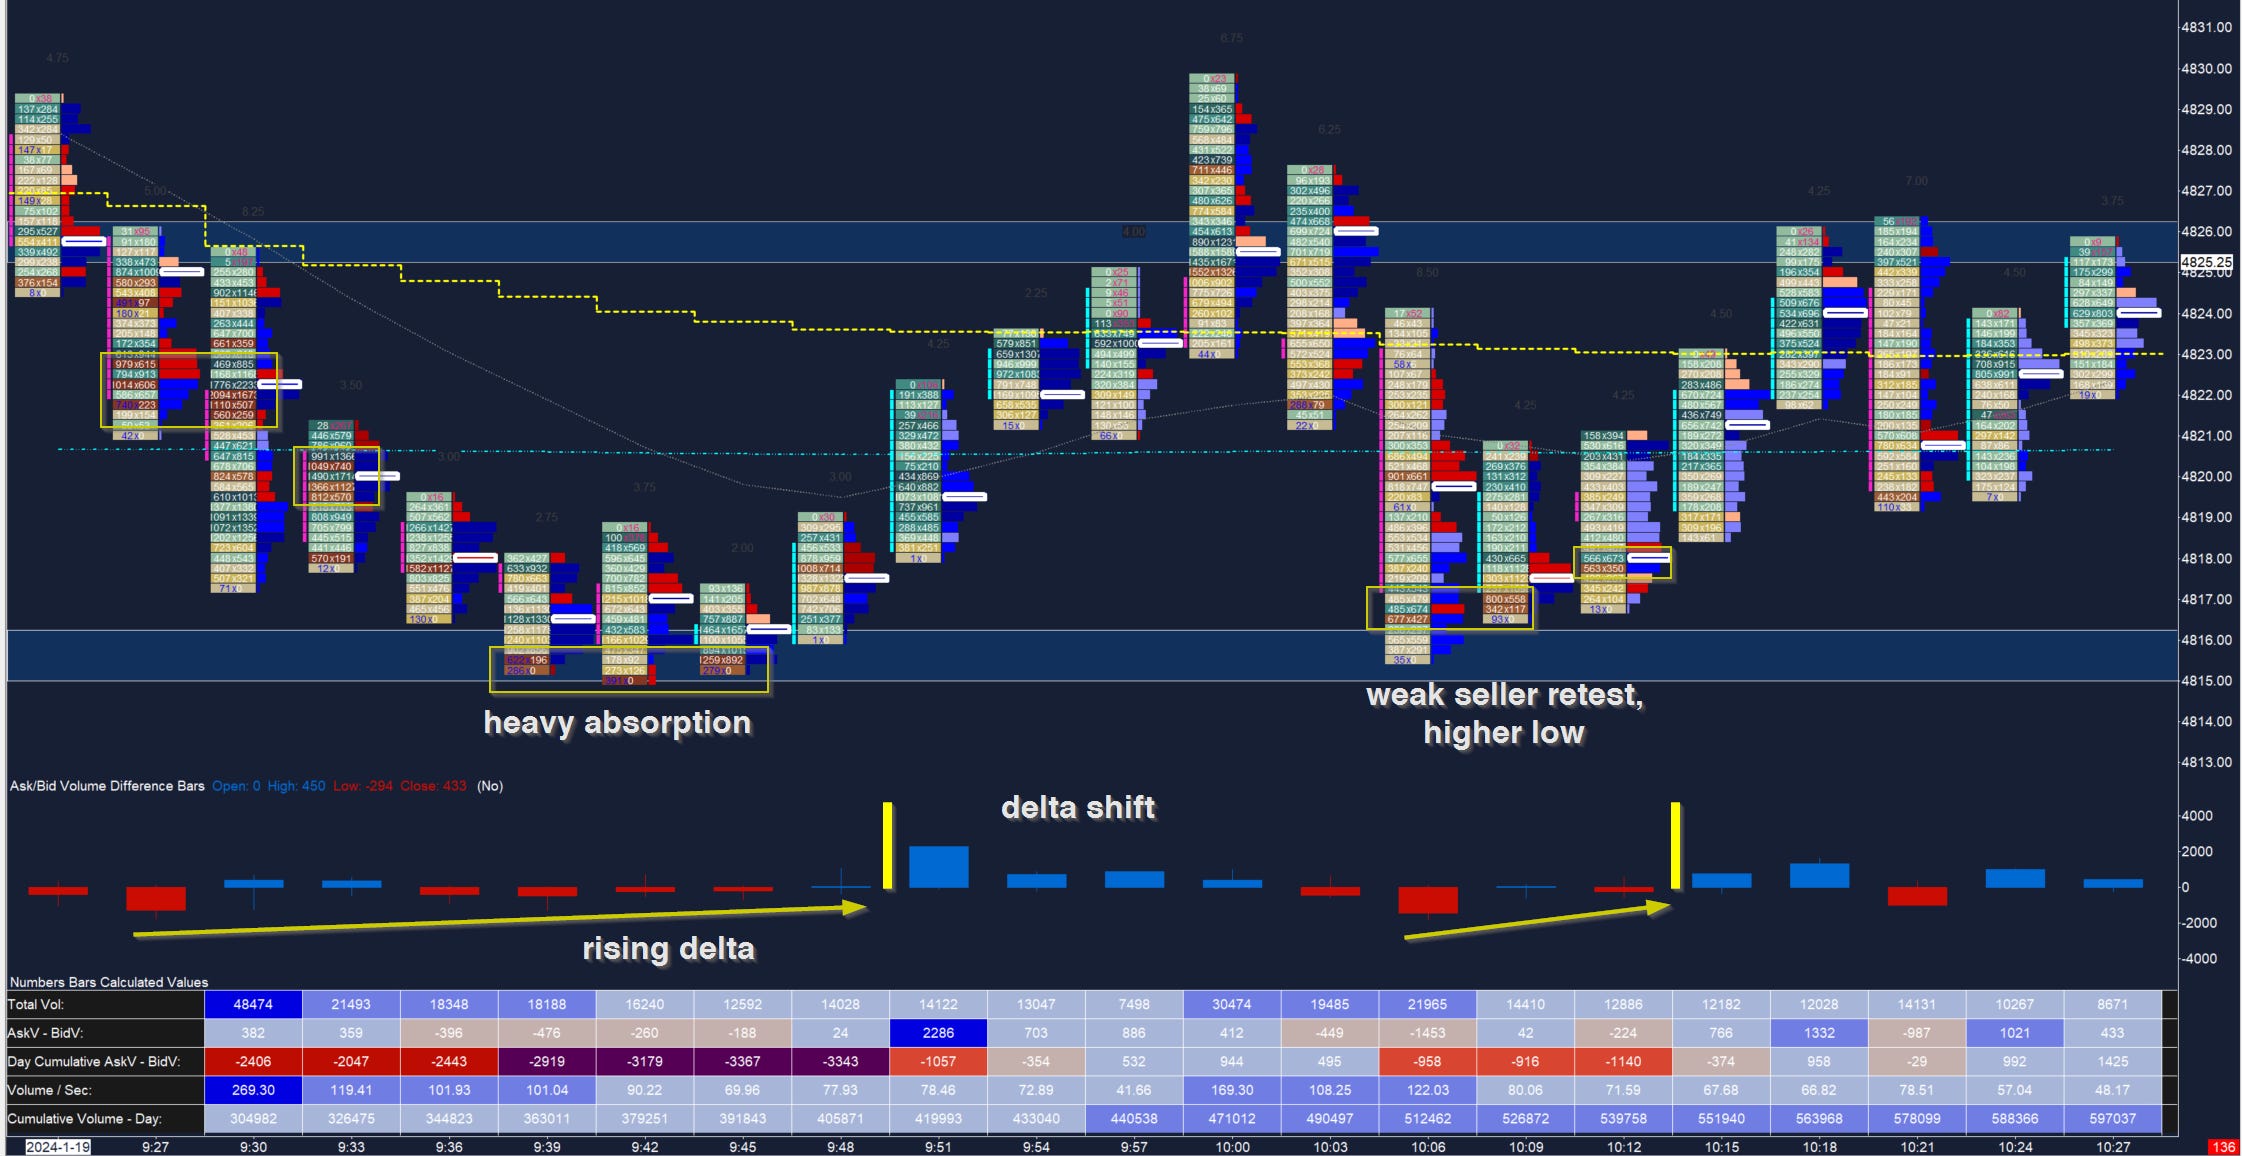
Great opportunities were found later in the day as well, especially apparent as buyers were in full control. For example, two low risk long entries presented themselves at lunch, usually a sleepy period. This was a further confidence boost to any long bias and potential inertia for the day’s final targets. Why waste a winning trade by leaving money on the table?
This first instance of retesting prior absorption is where I personally took a long into the highs, having missed out the morning.
Image 4. Friday afternoon long opportunities
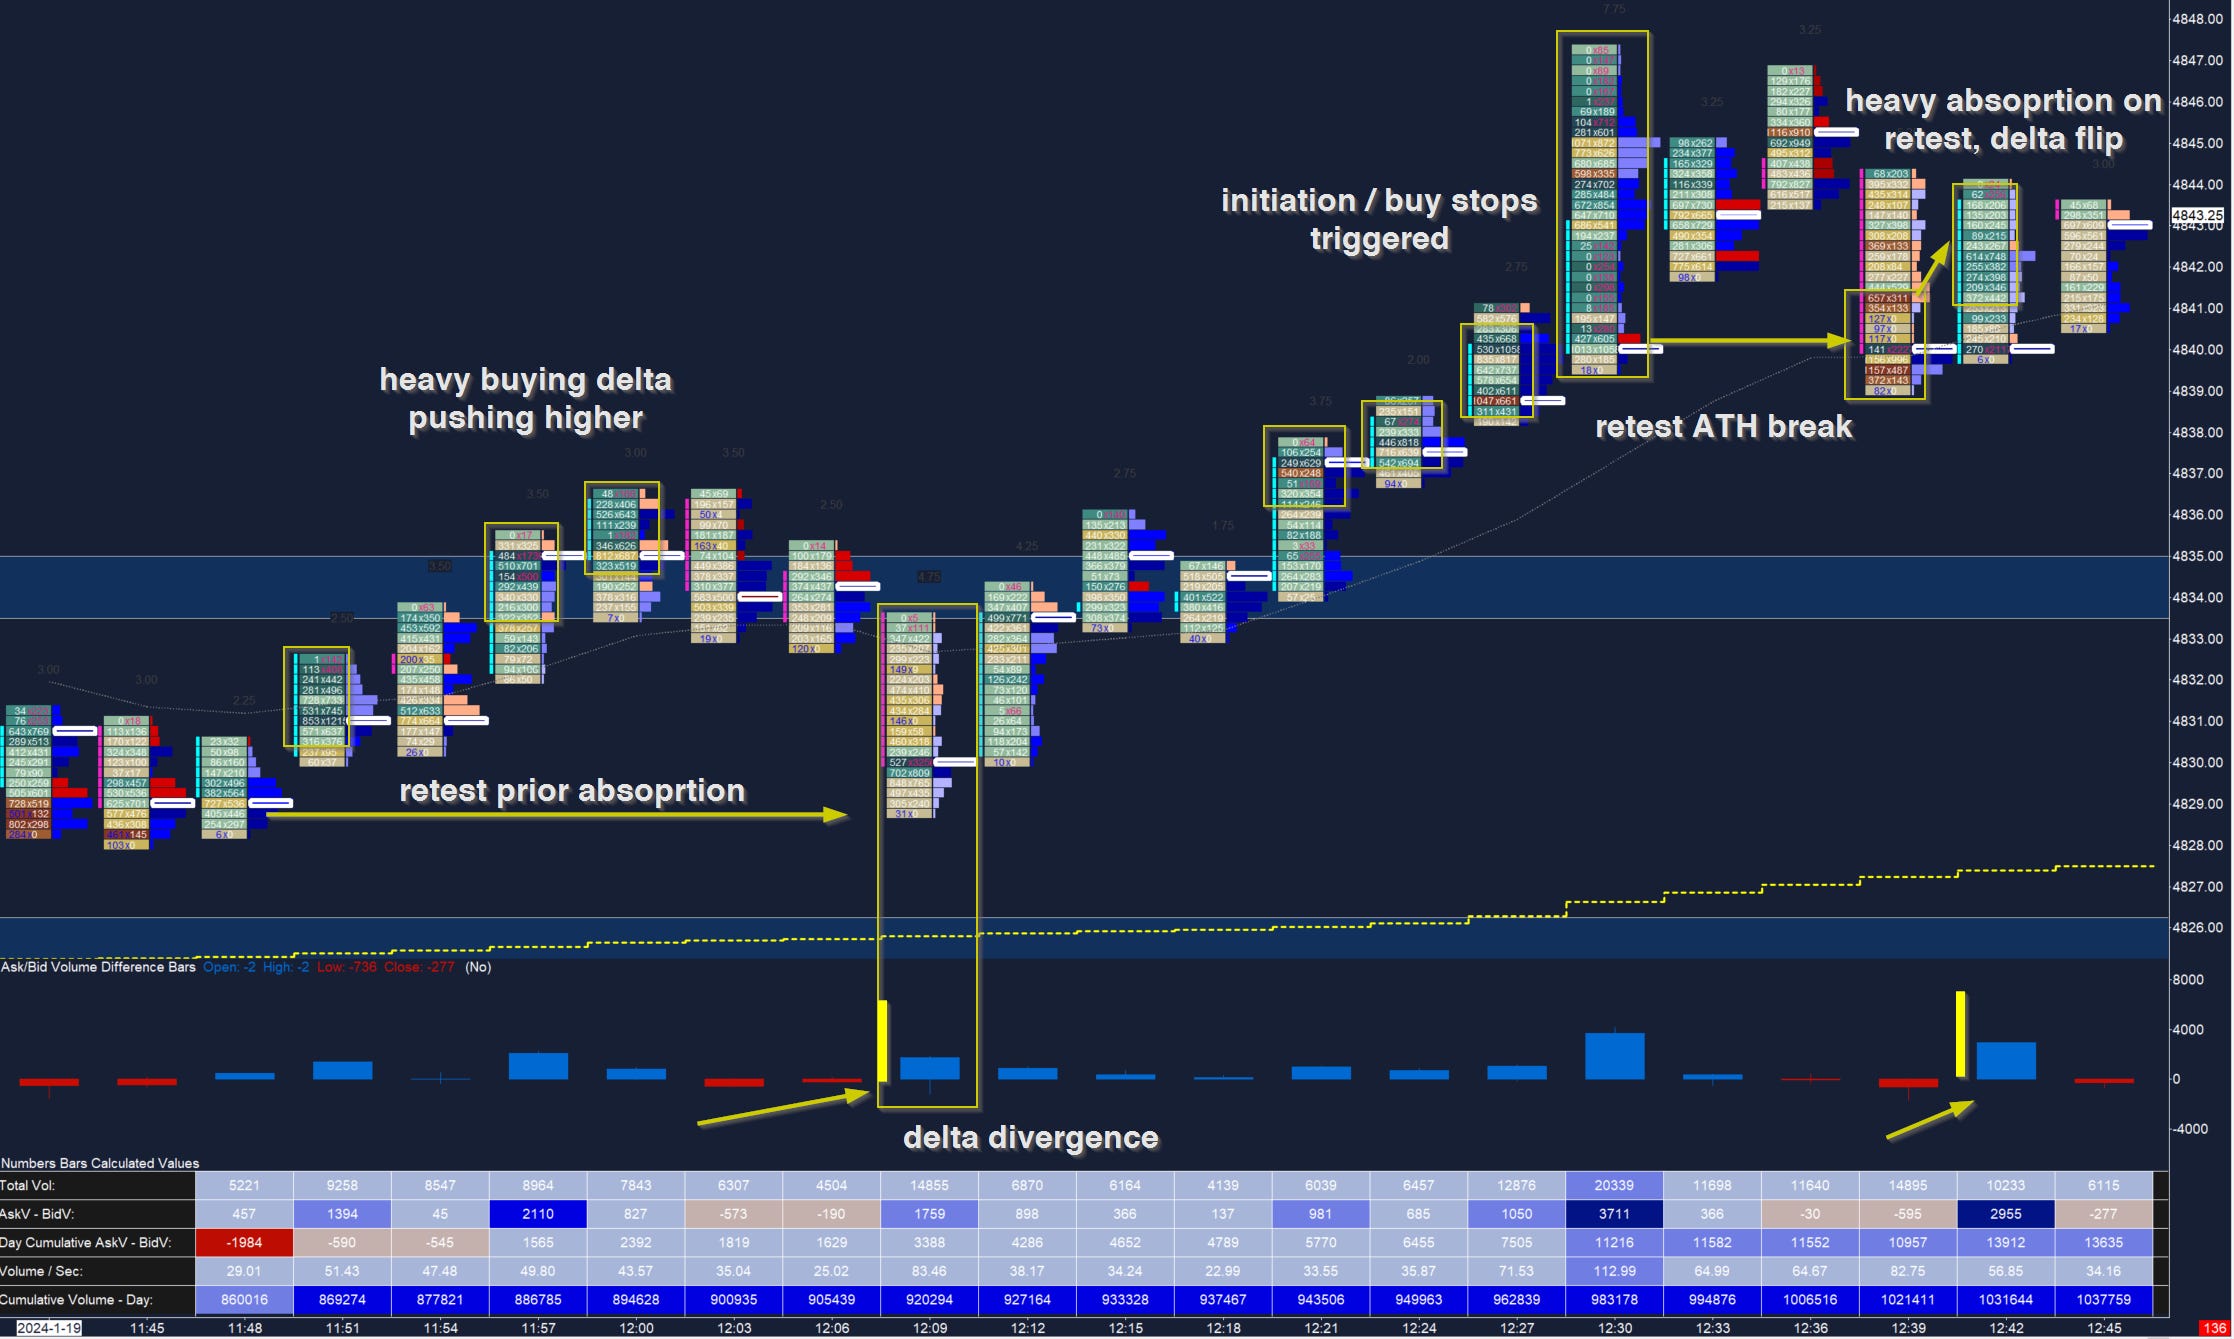
Further higher lows were possible entries, albeit with diminishing returns and none as defined as in the examples above, despite the strong OTFU. In general as we approach final daily targets it is prudent to avoid FOMO. Again, the best entries lean on prior areas of interest, with tightly defined risk.
Minister’s Missal
So now that the majority of folks are bulled up, how long can this move sustain itself without new volume? Interestingly last week’s pivot 4792 is now the 5D TPOC (4791). A clue that higher price may yet be in store is a shift of the short-term POC above 4800, with a daily close or two above confirming acceptance higher. Not to forget the 4792 level: this is also the 20DMA and just above the YVWAP of 4788.50, so an important area for longs to hold.
The main focus now is a either a continuation of this move, or a rejection of the breakout. We can speculate on levels above with no prior reference - but recall that a failed break in one direction can lead to a violent counter-move. This is especially true with weak structure below.
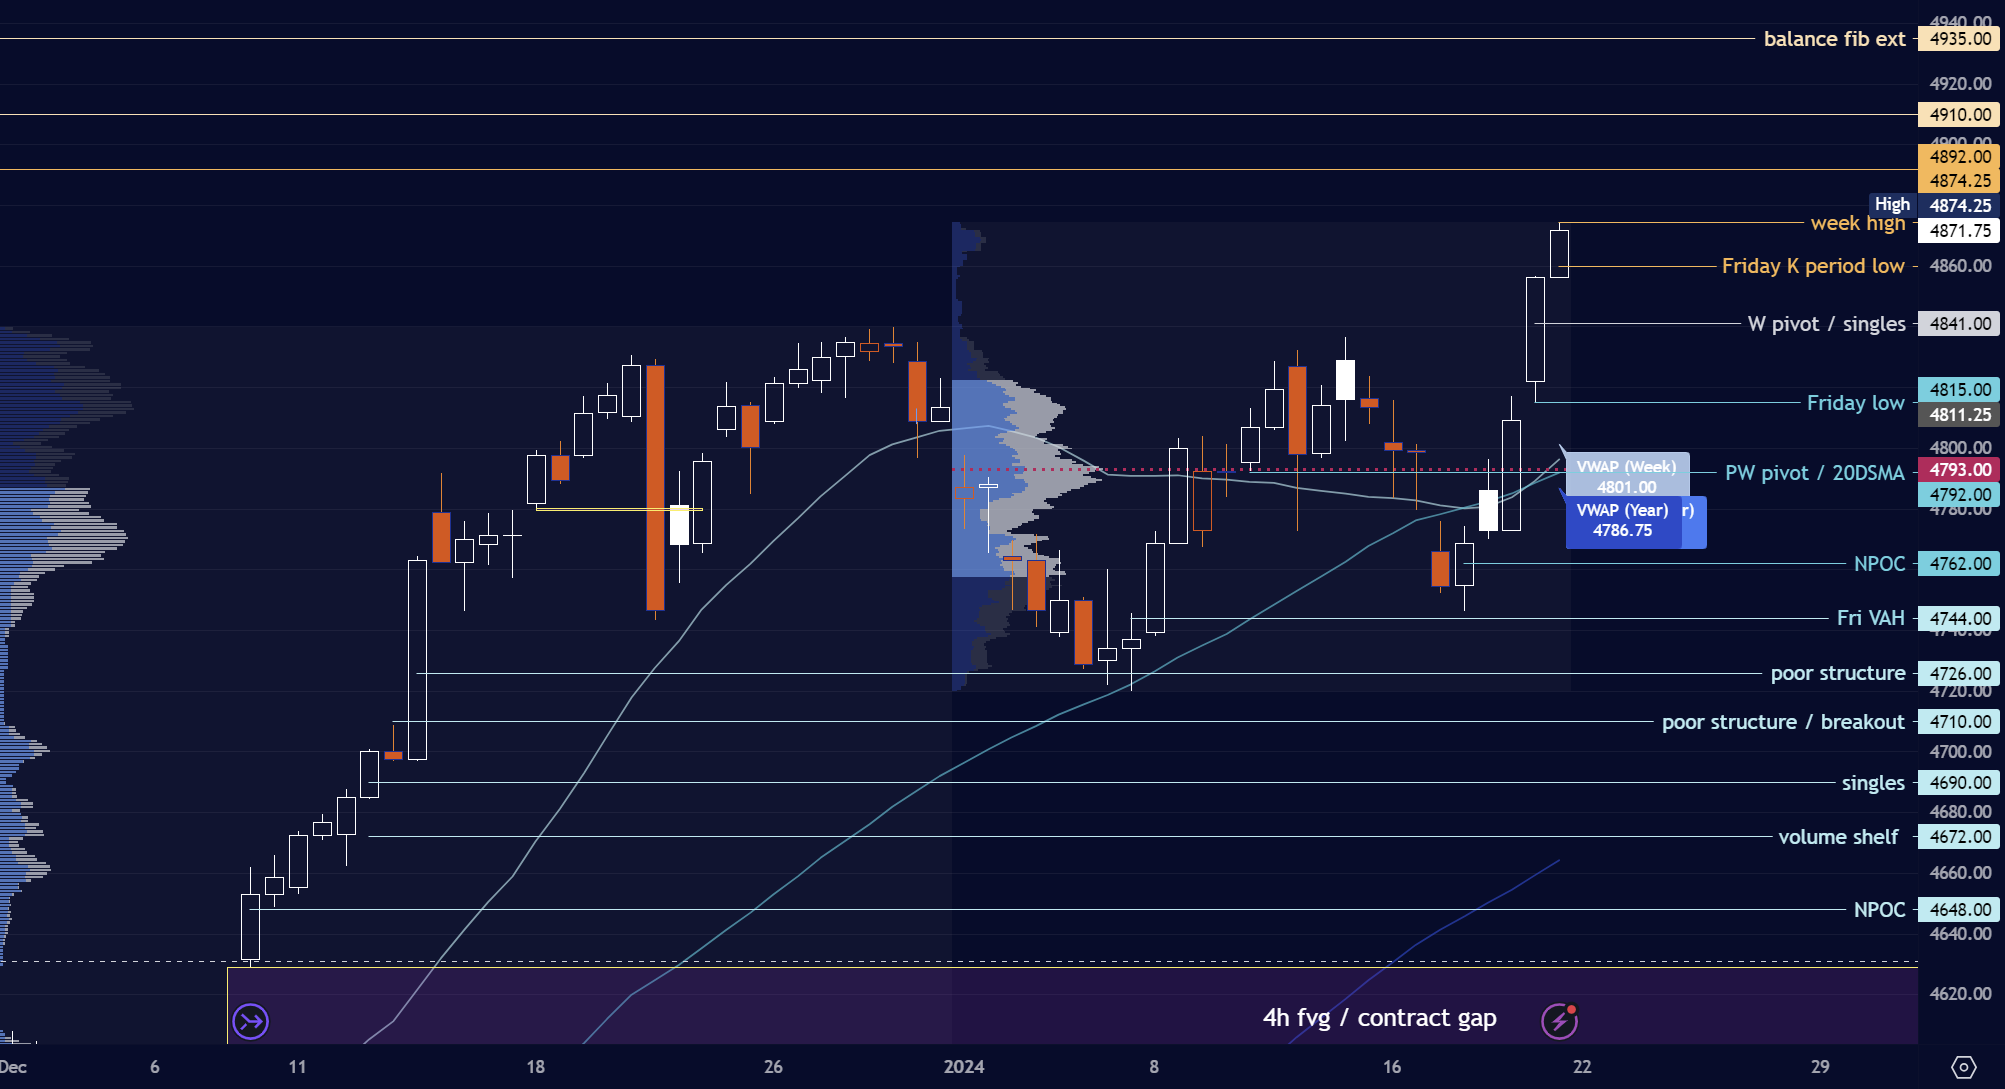
Image 5. ES balance and daily profiles
To keep things simple, the weekly pivot will be the 4841 breakout level. Buyers will monitor for signs of acceptance (time) above for a shot at 4910 and 4935 above. Sellers on the other hand need to see a rejection with a couple of subsequent closes below. This can see trade move back in the direction of 4710, another area of breakout.
Data Watch
FOMC is yet another week away when we may expect more volatility, although the PCE reading will likely give clues on Fed action. Important data points ahead:
Weds, Jan 24: European PMIs premarket; US PMI 9h45EST
Thurs, Jan 25: US GDP, unemployment, 8h30EST
Fri, Jan 26: Core PCE 8h30EST; pending home sale 10h00EST
I would also like to mention the most recent events in West Asia. Of course it is impossible to predict geopolitical events, let alone markets - however tension is increasing now with direct American attacks on Yemen, as well as consistent missile strikes on American bases in Iraq which have likely killed military personnel although this has not been released publicly.
Most recently American forces hit a potential command center in Yemen in a massive strike which killed a number of higher ranking officers and possibly Iranians as well. A Yemeni and/or Iranian response is not to be underestimated. Cutting edge military technology is seeing diminishing returns, while the strike capacity of less sophisticated forces has caught up. And despite the very high intensity and sophistication of the Ukrainian front, the lessons learned there regarding drone and saturation strikes to disable AD, for example, are being deployed by less endowed but increasingly equally capable adversaries.
Remember, a closure of the Straight of Hormuz is not only in the hands of Iran. It may even be beneficial to absolve all responsibility in the case of a strategic closure. The potential for Yemen to close all three waterways is there, and this would cause massive repercussions for the oil market and the world economy. The West is treading in dangerous waters, quite literally. Something to consider from a tail risk perspective while the markets continue to make new highs.
Expectations this week are for a range of 80 points with potential for a 30 point overshoot.
This Week’s Levels and Plan
Pivot 4841.
Levels to mark:
4935
4910
4890
4860 Friday K period low
4841 weekly pivot, 4842 single prints
4815 Friday low
4788 NPOC, buyer LIS
4762 NPOC
Image 6. Current ES levels and volume profiles
a) An early bid at the pivot can see Friday’s high retested, a break and close above will target 4890, with 4910 above - a zone where sellers are likely to step in. In case of continued buying pressure, 4935 is a further possibility. On the downside, sellers want to protect 4815 for attempts at 4900.
b) Sellers closing below 4841 on the daily look to break Friday’s low 4815. The can open up the two NPOCs below to 4762, with the 4750 the ultimate target. Sellers want to see 4890 hold for a shot at targeting 4792 once more.
Tip jar - content is always free, I appreciate your continued support!

Your support and comments are appreciated. I do my best to respond to everyone in a timely way. Be sure to follow me @reverend on X (Twitter) for the latest updates!
Don’t maintain bias in the face of contradicting information! Capital preservation is key.
This is not investment advice and I am not a qualified licensed investment advisor. All information found here, including any opinions, commentaries, and suggestions, expressed or implied herein, are for informational, entertainment or educational purposes only and should not be construed as personal investment advice. While the information provided is believed to be accurate, it may include errors or inaccuracies. I will not and cannot be held liable for any actions you take as a result of anything you read here. As always, conduct your own due diligence, or consult a licensed financial advisor or broker before making any and all investment decisions. Any investments, trades, speculations, or decisions made on the basis of any information found on this site, expressed or implied herein, are committed at your own risk, financial or otherwise.