
ES Weekly Review and Outlook: April 8 - 12
Value driven.
Image 1. Abandoned but not forgotten. Mary Kathleen uranium mine, Queensland

Energy and metals all strongly bid. Did someone sniff some change in the wind? Gold, oil, and uranium rediscovered love in the last few months. Even mentions of a possible super cycle as inflation is on the rise again. While tech grabbed all attention last year, perhaps her star shines less brightly as geopolitical relations break down (Israel’s recent attack on the Iranian embassy, followed by Ecuador’s storming the Mexican embassy).
A reminder to traders about traditional safe haven trades, and overlooked value to be had even in a market of historic valuations.
Short-term (and longer-term super cycle!) trading is all about conditionals: if/then. Traders failing to realize this early on will struggle with managing risk. For example, maintain a concise plan with clearly defined levels and a further set of conditions needed to execute trades against them.
Taking a look at last week’s outlook, I favored buyers if and only if on a break of 5323 on volume, otherwise leaving room for sellers to take charge early in the week. The high of the week was a) 5317 - the level; and b) buying volume was reserved - the condition.
Image 2. Prior weekly outlook commentary
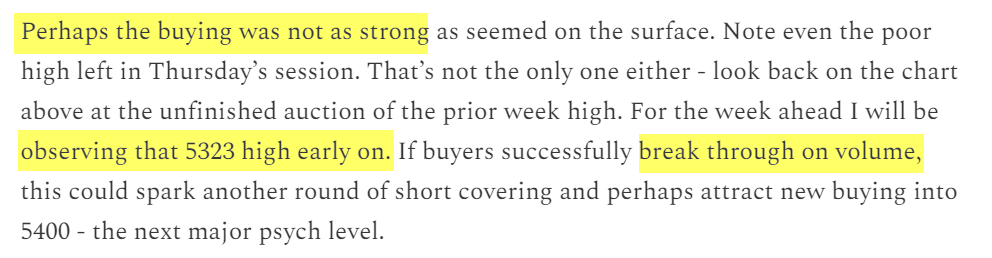
Now with the buying case unsatisfied - the week opening below the pivot after a ‘look above and fail’ in early Monday globex - sellers took control early in the week. This is what I mean by contextual clues - not to blindly short or long levels (although this can work too, if your levels and risk management process are good), but to gauge market generated information to your advantage to precipitate higher probability trades.
If you enjoy my plans and educational content, you can show support by sending a ko-fi to the link/QR below. All my work remains free. However a token of encouragement goes a long way to let me know I’m helping your trading and understanding of a (now hopefully less) complex market. Comments, likes, retweets and sharing with your friends are genuinely appreciated.
Minister’s Missal
This was an exceptional week for short-term traders. A total of twenty Fed speakers including Powell, along with important data releases brought some much-anticipated volatility, especially later in the week.
The economic takeaway, barring frequent later data revisions, is a stronger than expected economy sustaining strong employment (although much of that part-time, go figure) and persistent inflation. Basically no real reason for the Fed to cut. Although the US elections will undoubtedly be the political pressure to do so.
Image 2. ES daily profiles and concepts. Click to enlarge
Following a break of the prior inside week, we very nearly filled my last weekly downside target. Well done, sellers!
Image 3. Last weeks levels
For last week’s review, I want to explore some of the concepts in the chart above rather than over-analyze individual days. This is a great lesson for using structural levels from the profile in the context of intraday trading. Again, zooming in on precise entries may be done with a tick chart, the 5m, the 1m - whatever your preference is. But the profile gives you a great sense of areas more likely to get attention, either as resistance, support, or as a magnet.
I. Balance area poor high. This was a suggestion of trapped buyers and a crowded trade. Note where balance closed: below POC and balance IB. In other words, buyers would be underwater if sellers took initiative.
II. Look above and fail. This ‘rescue mission’ of the prior poor high/PWH fell short of a break, and indeed my weekly pivot, indicating buyer weakness. This was a great lean short perhaps even for a swing, with stop above PWH - confirmed with Monday’s IB close below the PWC.
III. Buyer support. The next day opened with a strong gap down. This left little room for a short trade in RTH to my final level as we were near an extreme. The clue that sellers were taking a pause as intraday left a mini buying tail precisely at the FOMC VAL. The day closed at the high, indicating a possible relief trade long.
IV. Gap fill. The next day opened above the PD POC, with zero selling interest below. The long trade targeted the gap above, with a fill and acceptance with an hourly close above signaling likely continuation. This was not quite satisfied although buying was strong on the tape and the close was within the prior balance, another main objective of buyers.
V/VI. Structural references. In profile trading you will often see concepts like prior singles and poor lows used as intraday targets. Indeed the long trade from the day before opened on a gap up, closing the prior gap and targeting a fill of singles above. However a look above and fail into these singles transpired into a liquidation on strong economic data - targeting a pre-FOMC poor low. With no further momentum below (a one point break I do not consider a ‘complete’ auction, rendering a poor low into a weak low), inventory correction into the close suggested sellers might be ready for a pause.
VII. Repair of poor structure. Thursday’s liquidation left behind four sets of singles, which are frequently later revisited in the auction process. Friday’s look below and fail of the prior M period spike high 5210 saw buyers step in - natural targets above would be the fills of the four sets of singles. Two were filled, and a poor low on one partial fill suggests an incomplete auction above.
Weekly Context
We are now in balance on the daily and the weekly - although this is the first break of a PWL since mid February as sellers show a strong hand. We remain OTFU on the monthly, with the last week’s low very near the March halfback. With the weekly in balance, a break of the high or low on volume likely sees continuation in that direction. Ideally either buyers or sellers would see consecutive daily closes in the direction of the breakout, or risk a potentially stronger move in the opposite direction.
Image 5. Weekly profiles, ES
Last week’s close at 5250 is an exacting level of indecision (a term I’ve coined), but given the strong sell delta I suspect sellers are looking for further reward IF time is spent below the prior balance low of 5263. I will thus use this as a straightforward pivot heading into the week.
Short-term (five day) value has moved down from 5286 to 5237. Sellers’ medium-term goal is to bring value back below 5200, which may be achieved with consecutive closes below 5190 early this week.
Medium-term (20 day) value is at 5237 from the prior 5223, indicating that the trend is still up: overall favoring dip buyers despite the lower high and low last week. This is the tune until we are met with a sellers’ market… and the interim bearish frustration is often useful to maximize capital extraction.
Don’t marry your bias and trade what’s in front of you.
Data Watch
Inflation is the potential mover this week, although in the context of the Fed essentially giving up on inflation I think this is largely priced in.
Weds Apr 10: CPI 8h30EST; services PMI 10h00EST; FOMC minutes 14h00EST
Thus Apr 11: PPI, unemployment claims 8h30EST
Fri Apr 12: consumer sentiment 10h00EST
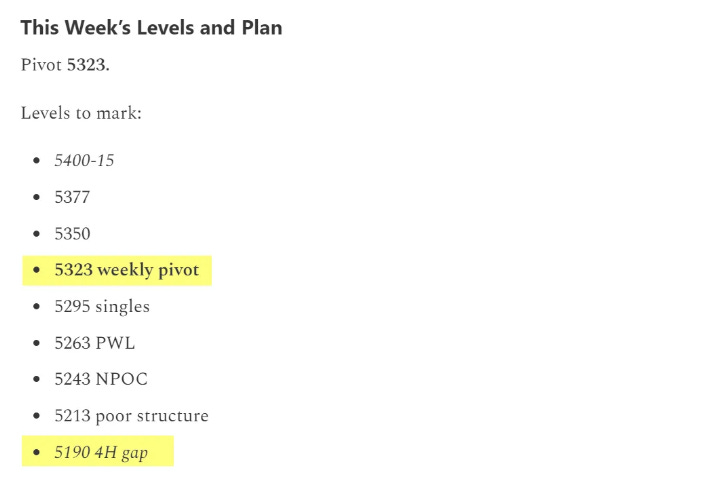
This Week’s Levels and Plan
Pivot 5263.
Levels to mark:
5379
5357
5323 high
5282 LVN
5263 weekly pivot
5216 buying tail
5190 4H gap
5157 weekly low
5133 contract gap
5083 support
5061 4H gap
Image 6. Current ES levels, 4H chart
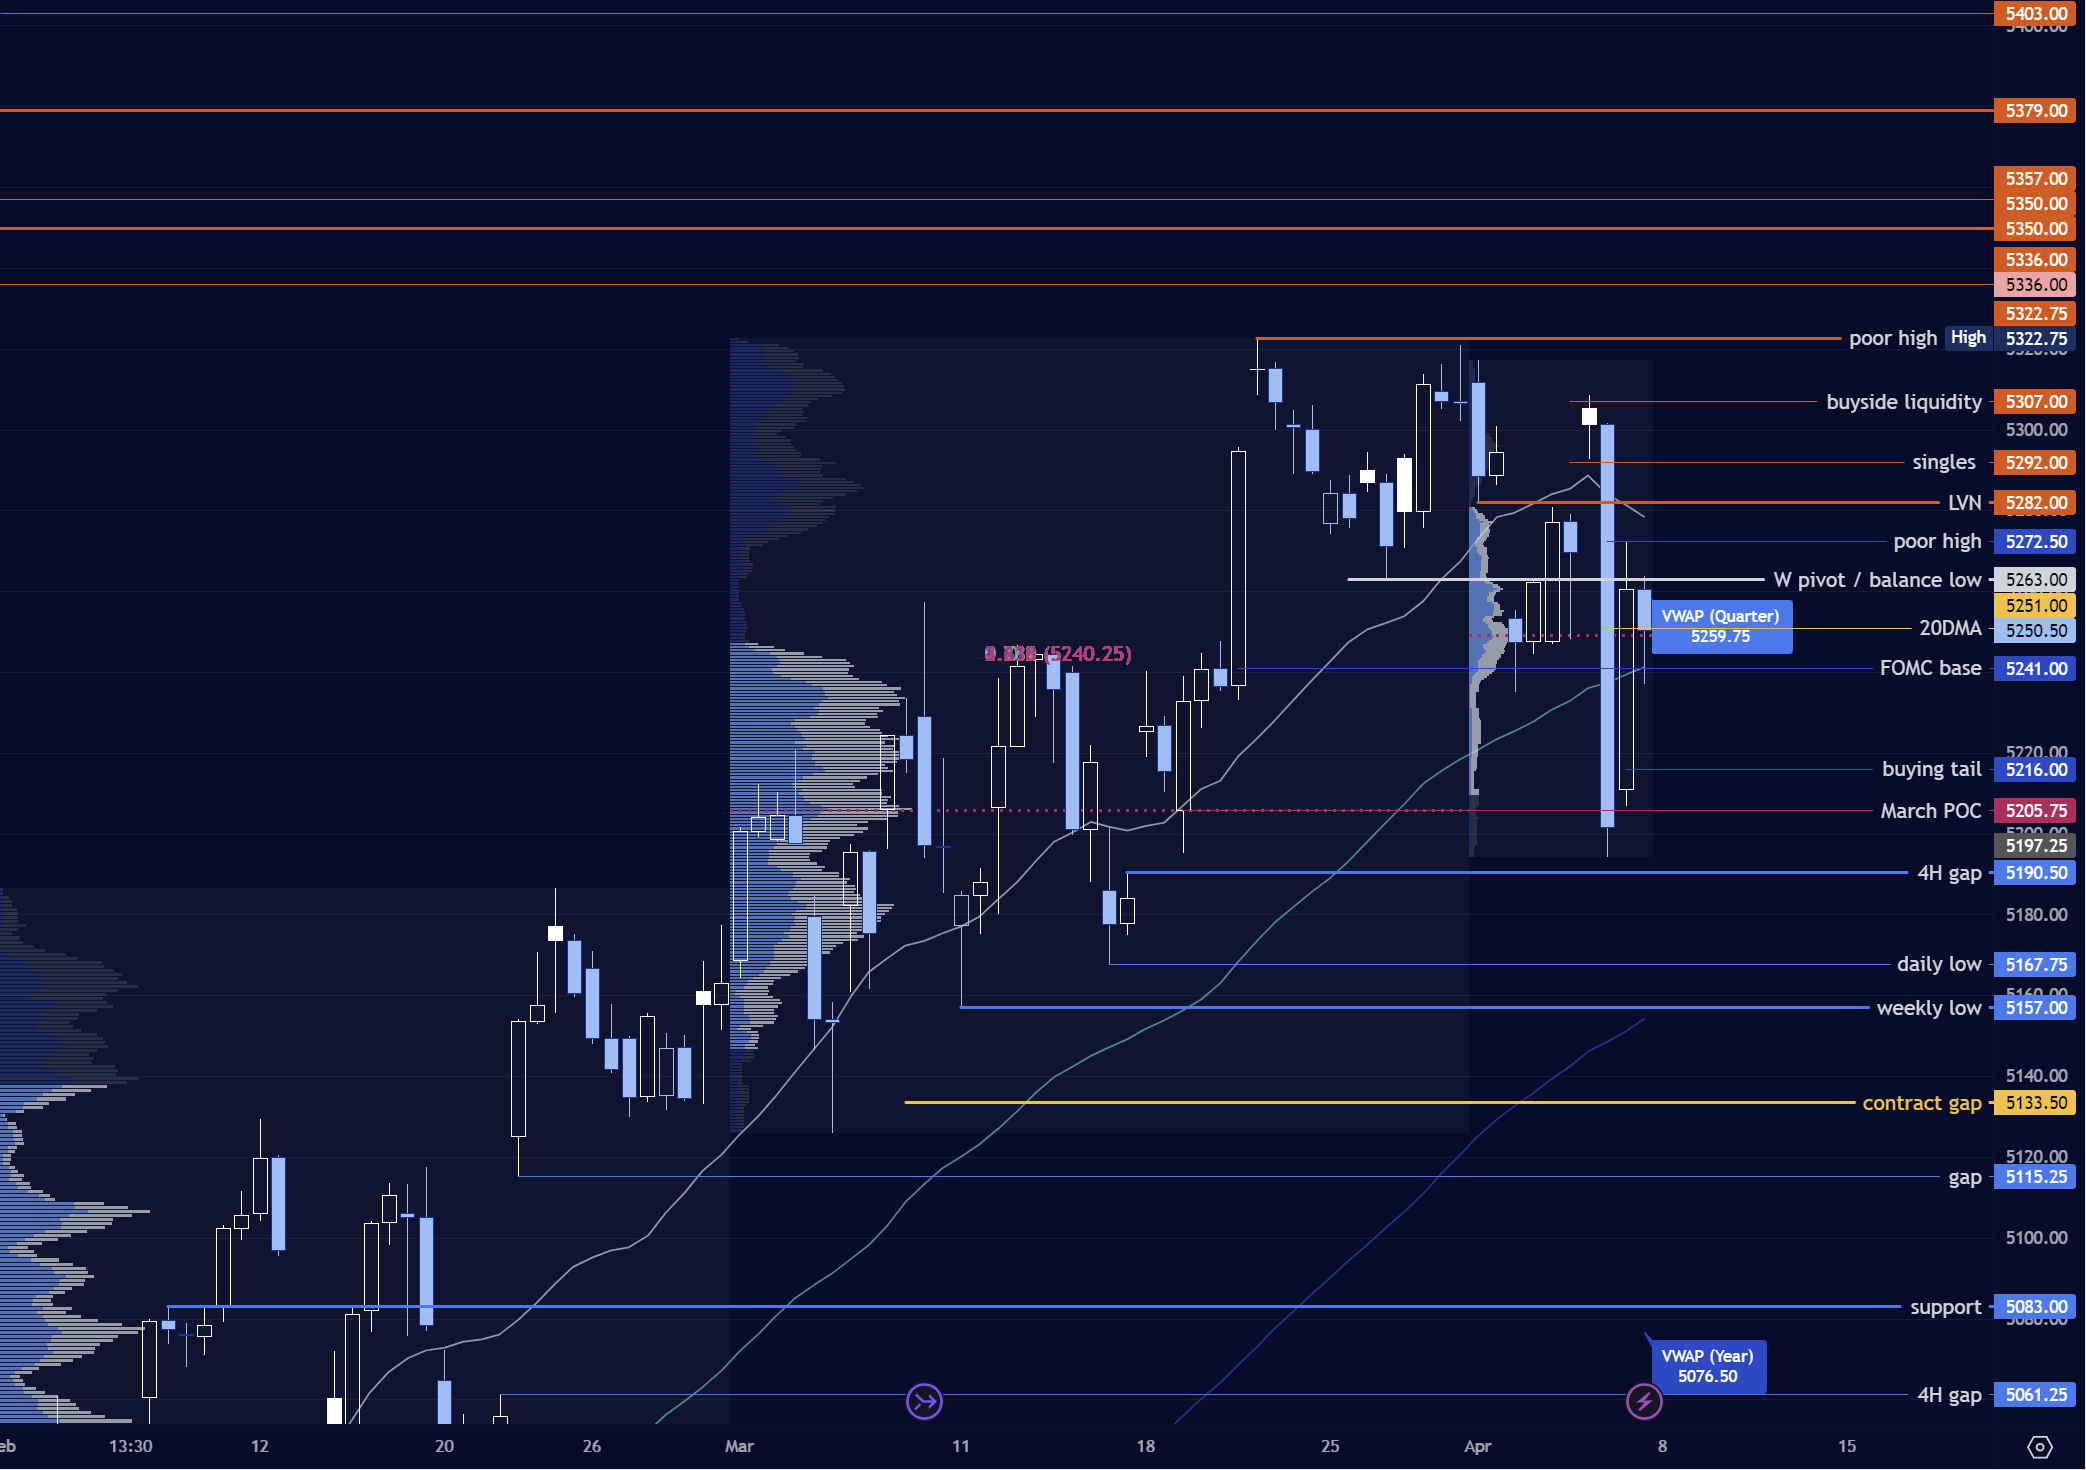
a) Defense of the 5216 buying tail early on targets time above pivot and a close over the 5282 LVN which can potentially trap sellers. Longer-term sellers may defend 5300 but further momentum over 5310 targets a break of the highs to 5357, 5379, and 5403 at an upper limit. Buyers’ LIS is the 5190 4H gap.
b) Time under the pivot and a break of the weak low / 5190 on volume targets 5157 and the 5133 contract gap, both areas where buyers may bid. Liquidation could see 5100 with ultimate support at 5083.
c) Feel free to request analysis on your favorite tickers in the comments below or on my X (Twitter) feed. I will continue to track my favorites like TSLA, BTC, CL, and GC on a regular basis.
Tip jar - content is free, I appreciate your continued support!

This journal remains free, but you can support my work by liking and commenting (including what you’d like to see more of!), and most of all by sharing my work with folks you know or on Twitter. Your support is hugely appreciated and helps keep my publication ongoing and timely! Be sure to follow me @rareverend on X (Twitter) for the latest updates.
Don’t maintain bias in the face of contradicting information! Capital preservation is key.
This is not investment advice as I am not a qualified licensed investment advisor. All information, opinions, commentaries, and suggestions, expressed or implied herein, are for entertainment or educational purposes only and should not be construed as personal investment advice. While the information provided is believed to be accurate, it may include errors or inaccuracies. I will not and cannot be held liable for actions you take as a result of anything you read here. As always, conduct your own due diligence, or consult a licensed financial advisor or broker before making investment decisions. Any investments, trades, speculations, or decisions made on the basis of any information found on this site, expressed or implied herein, are committed at your own risk, financial or otherwise.
Can you explain where you would enter the trade for look above and fail? Is it in the B period with stop above A period. Also, what would be the trigger exactly, is it just about it being a very good r/r point with a daily close that was bearish?