
AVWAP Course: KISS
Keep it [Stupidly Simple]. Sept 11, S&P500 (ES)
Each week I review key moments from recent price action in the indices. These instances will be analyzed using three methods: the tape / DOM; footprint; and candle chart. Synthesizing the three allows an understanding greater than the sum of its parts, leading to a complete understanding of the auction process. There are many great resources out there, although I am not aware of any that provide such a comprehensive study guide.
Image 1. Don’t.

Trading the Trend
The last AVWAP course unpacked possibly the hardest day type to trade: the balance day. The two-way action sees traders to ‘finally see’ the direction the day will take, only to buy or sell the last tick before price reverses and they are forced to stop out.
And thus fueling the reversal. Only the repeat the process again.
Trends are in theory easier to trade, as long as you avoid bias. Which risks sending an undisciplined trader’s newly funded account to zero. Or worse.
Image 2. Don’t let emotion get to you

But before we go into anchoring VWAPs all over the chart, let’s consider the theory supported by the profile. After all, we are creating a live narrative of the price action, and the profile is perhaps the most fundamental tool for this - after the tape.
We need the basis for our intraday thesis, and the profile is always where I begin, regardless of the asset class.
Making a Thesis
Easy enough, right? The overnight session was ‘p’ shaped, indicating absorption. So bulls would be looking for a break of the overnight high (ONH) for continuation, while defense of the ONH would most likely see ranging-action. These clues are very important to keep in your back pocket.
Stay informed, stay sane.
Image 3. Sep 9-11 ES profiles
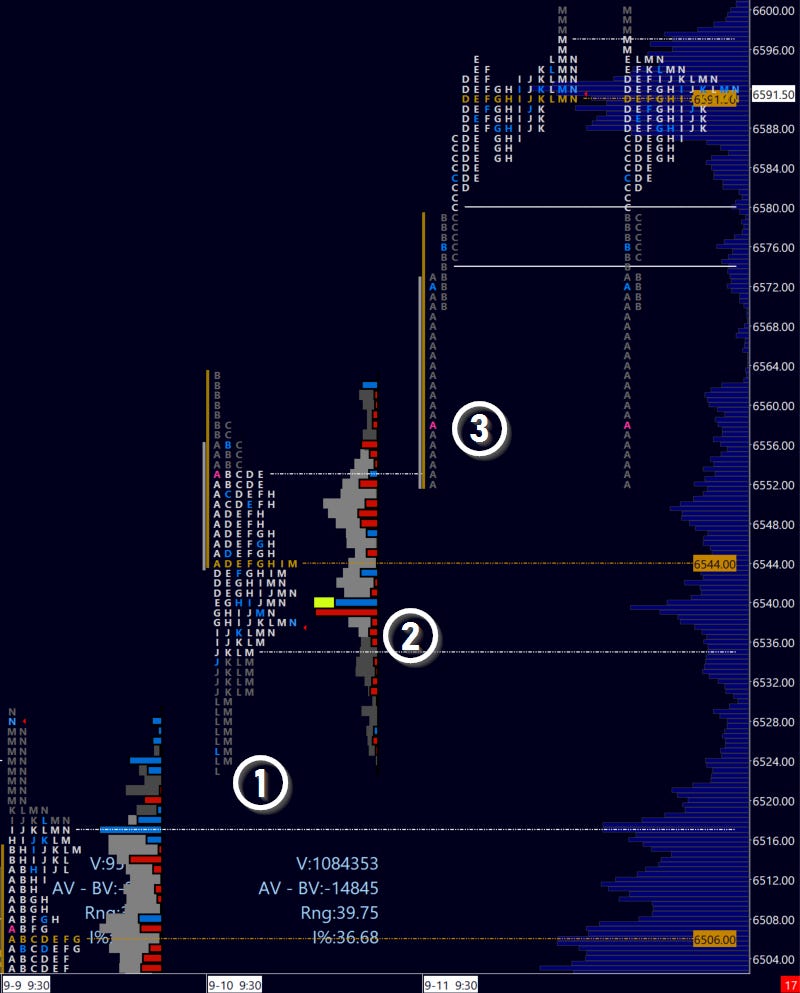
Let’s take a look at clues from the profile.
On September 9, we closed at the high of the day on a spike into close. On the following day, the market initially traded higher on a gap. That was filled later in the day, but the session closed back in value above the prior day’s high, while leaving a weak low.
That tells me a number of things. First, sellers were not particularly aggressive at the open. The more time spent beyond a certain reference point, the more those prices will be accepted.
Second, the weak low suggests trapped shorts…Finally, the quick rejection of the lows to close back within value and above the PDH tells me that selling is likely complete. This is the foundation of our thesis for prices to continue their upward trajectory following a multi-week breakout.
Now our day in review. Note the open above prior day value initial selling. Consider two things: the slow speed of the selling, and the rejection of the prior day value area. Our long thesis into new highs is now compelling.
Now how do we trade this successfully? How do we identify multiple opportunities for razor sharp entries on minimal risk? Let’s find out using the AVWAP!