
AVWAP Course: Exhaustion Lesson IV
January 17, S&P500 (ES)
Each week I review key moments from recent price action in the indices. These instances will be analyzed using three methods: the tape / DOM; footprint; and candle chart. Synthesizing the three allows an understanding greater than the sum of its parts, leading to a complete understanding of the auction process. While there are many great resources out there, I am not aware of any that provide such a comprehensive study guide.
This lesson is part of a longer series using the anchored volume-weighted average price (AVWAP). Most trading platforms have this feature. It does not make a difference what timeframe or chart type as volume and price are independent of time. The following lesson will share some helpful strategies for using the AVWAP to identify potential entries (and exits).
Anchor Type: Exhaustion
As I have written before, the art of using the AVWAP is based on choosing the proper anchor point. Much of this is context driven - sometimes it is as simple as a local bottom or top, other times it is taken from the entrance of a large player on the tape.
This lesson will focus on using an exhaustion low following significant seller absorption leading into excess - as a pair of anchors. Last week we looked at the mechanics of an exhaustion high on a clear spike to the upside that was rejected. That required fast action and thinking.
In our case this week, the action was nuanced but no less clear. The advantage being that this gave the trader more time to consider the trade. In fact, the closing of IB and open of the C period made it clear that sellers were trapped, and their low marked the anchor point for exhaustion.
I will structure this lesson around two concepts - trading in the direction of inventory correction at the open (following net long inventory on the inflation data) using a simple pre-market high; and trading a confluence of AVWAPs for added conviction.
Let’s look at a five-minute candle chart first.
Candle-reading is a fundamental tool and can tell a similarly strong story as the tape, Renko chart, footprint - or whatever method you may be familiar with.
Image 1. ES 5m chart
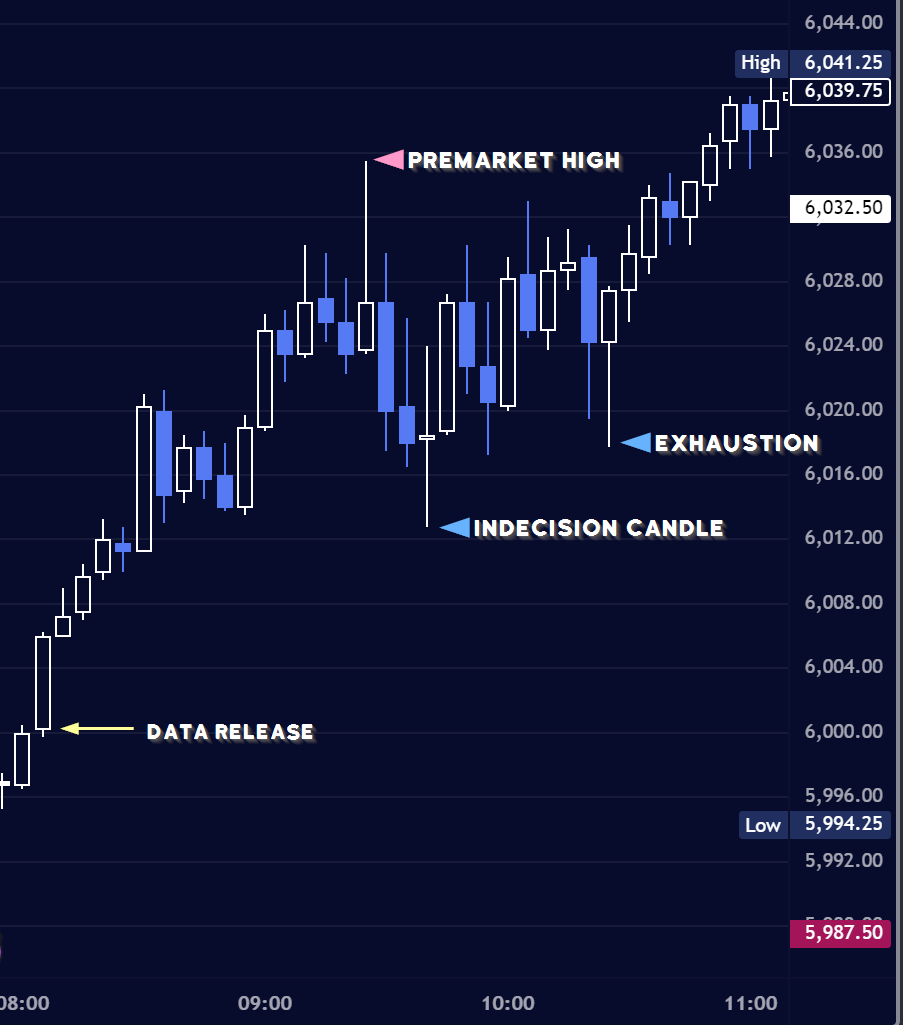
Candle qualities:
A. Premarket high. Note the wick to the top, indicating the presence of responsive sellers. This might suggest to you that the opening may see some follow-through action. And recall that 70% of the time, net long or short overnight inventory sees correction at the open.
B. Indecision candle. This classic shape closing at or near the open with long wicks to either side suggests that neither side is in control although significant inventory is building up at this location. A retest and rejection (in either direction) of this indecision area later in the day may see an unwind of positioning to one side or another. Often the start of a trend.
C. Counter-bid candle. A deep hammer, also if the tail is 2x the size of the body or more indicates that sellers have temporarily exhausted supply, and buyers must pursue higher prices to find inventory. A close near the highs can suggest
Inventory Correction
Image 2. VWAP anchored to pre-cash high
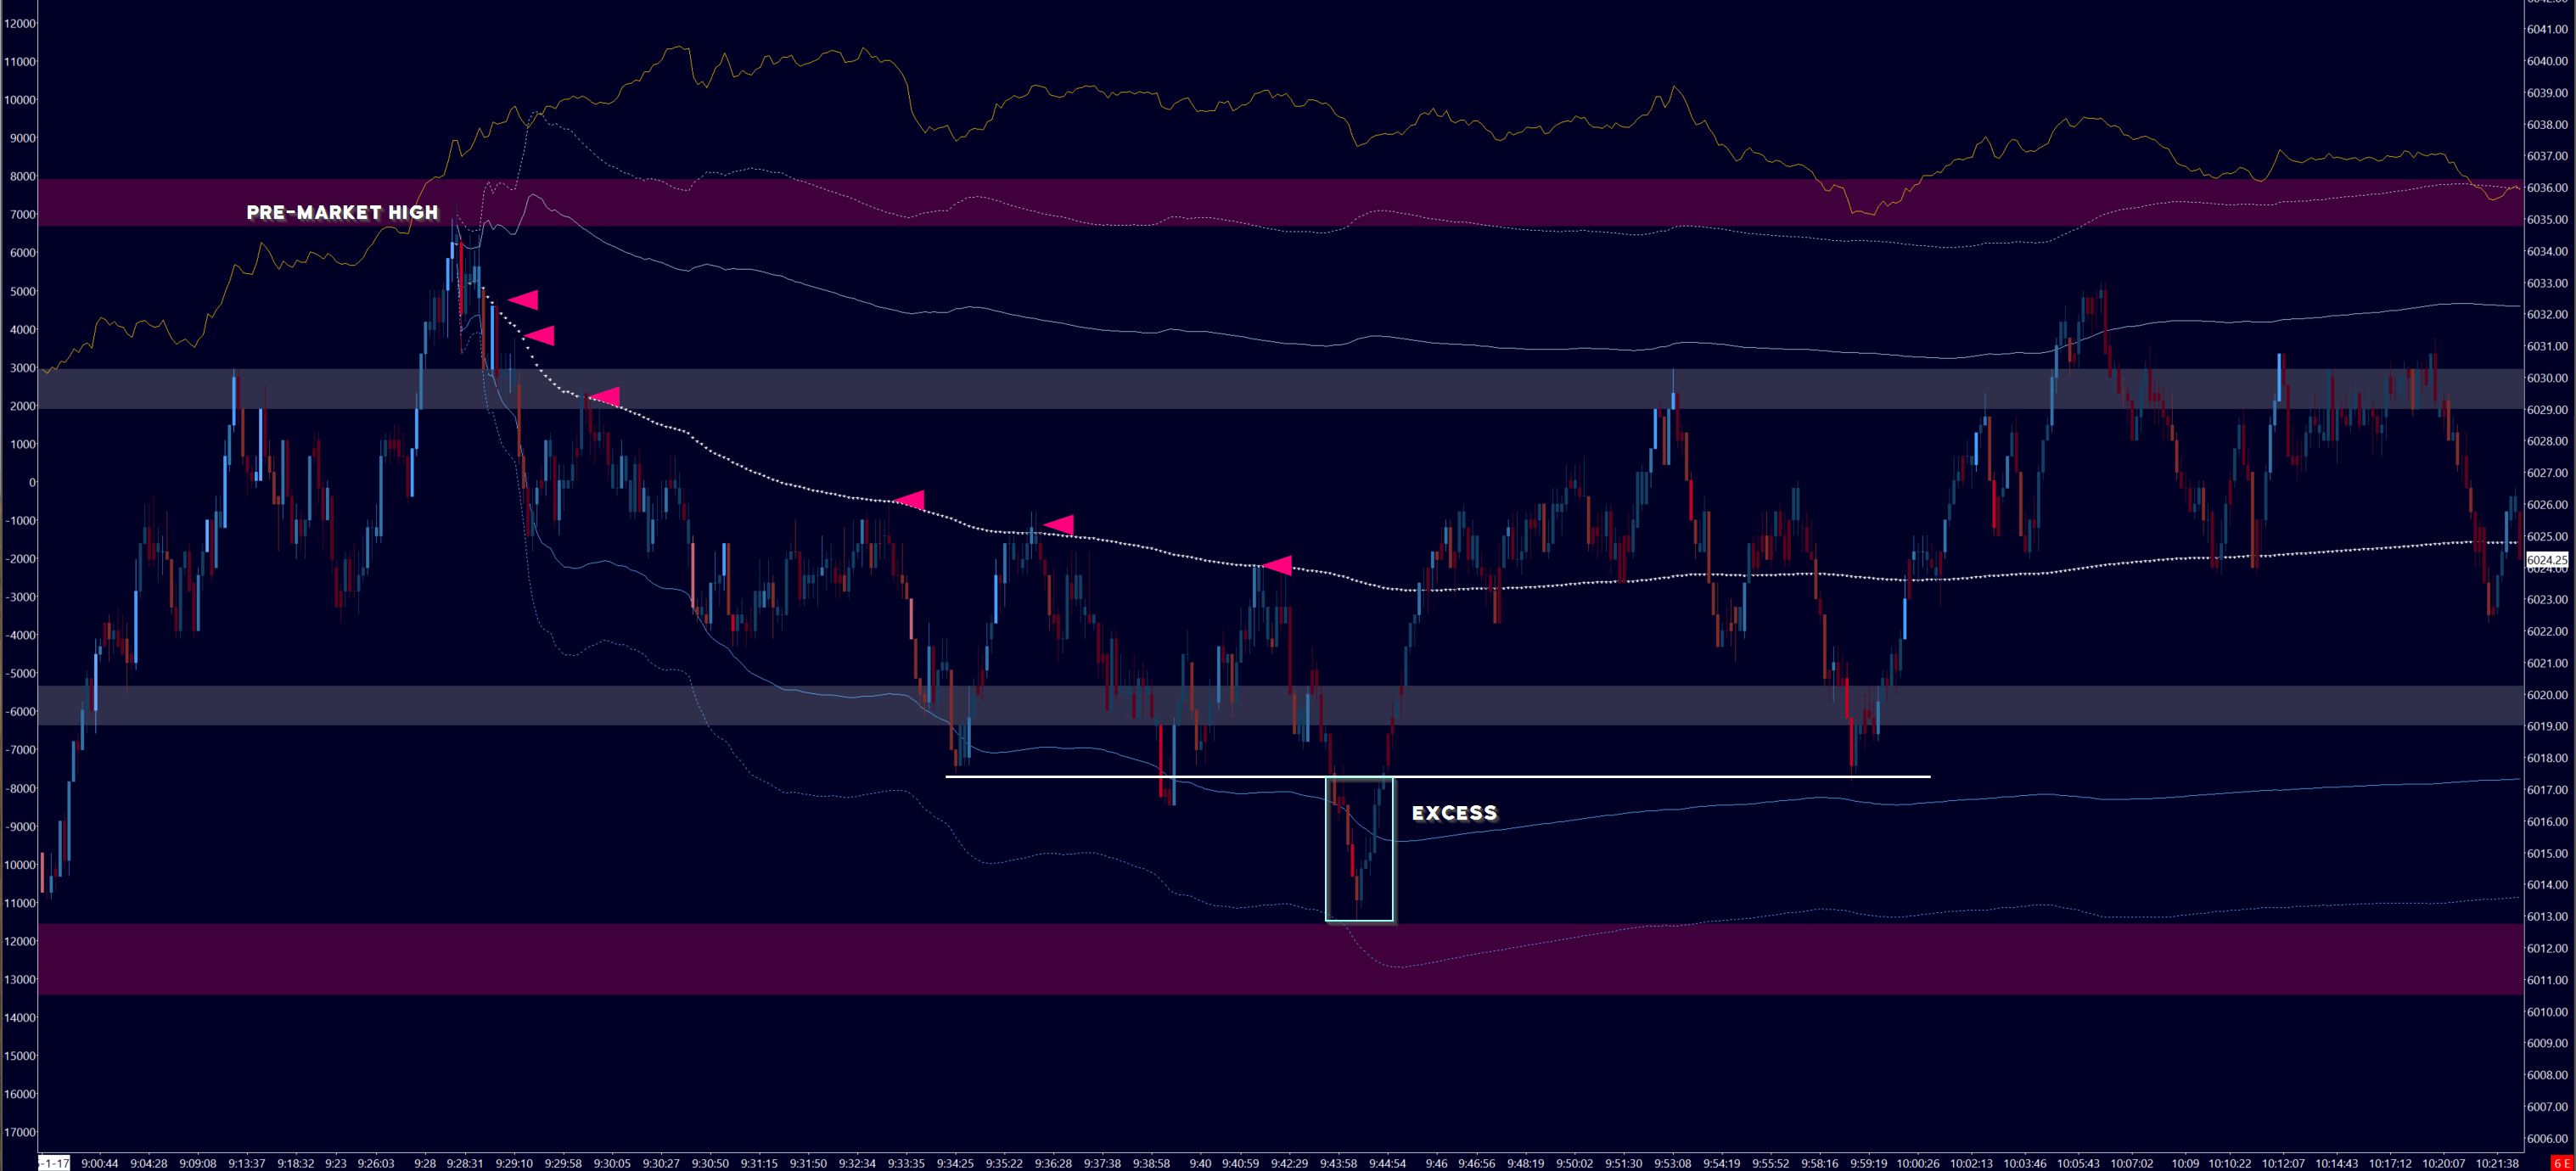
a) Context. This is another ‘unequivocal’ VWAP anchor point, marked to the highs. Don’t overthink the anchors at highs or lows - especially for newer traders less familiar with nuance of price action, these can be useful tools early on.
The anchor can be set right ahead of the open at the high in the expectation (or at least the possibility) of inventory correction as we mentioned above.
b) Execution. Given that trapped shorts (old business) or late longs will be looking for an exit, the unexpectedly high prices at the open present a quick opportunity to close out long-standing or on the other hand, poorly planned impulsive trades.
There is not much room to think - these are responsive trades. A new trader may prefer to sit out the action at the open, this is the field for scalpers or otherwise high conviction for a reversion trade. Why not wait for the IB close? Trust me, I’ve got a good trade coming further down in the lesson!
Shorts can be taken against the AVWAP, as in Image 3. These are clean trades although risk should be tighter given the shallower moves that often come with inventory correction. I sometimes use a rule of fives and tens - taking the majority of profits off at 5-7 points, more at 10 and 15, and beyond for any runners. Indeed the opening high spiked into 6029, with a rapid sell into 6022. A retest of 6025 lends to quick sell into 6018 - twice - until we finally see excess into 6013. That is roughly 15 points from the open, and on the rule of 5s.
These blocks of 5 and 10 suggest mechanical trading - sellers may not necessarily be in it to win it. Another important piece of context.
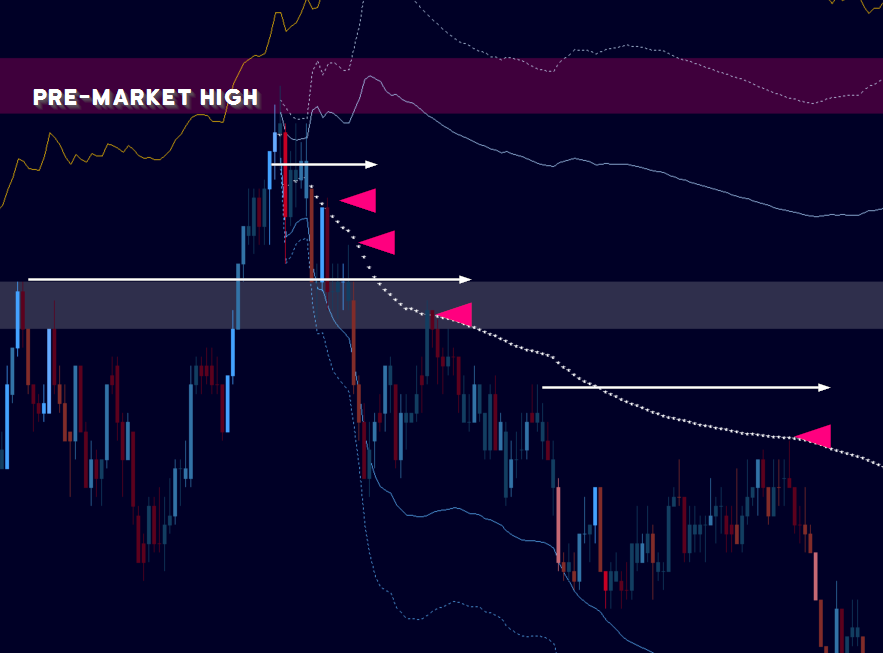
Image 3. Close-up view of shorts against AVWAP and suggested stop references
Next, how do we define excess?